Thank you for visiting nature.com. You are using a browser version with limited support for CSS. To obtain the best experience, we recommend you use a more up to date browser (or turn off compatibility mode in Internet Explorer). In the meantime, to ensure continued support, we are displaying the site without styles and JavaScript.
- View all journals
- Explore content
- About the journal
- Publish with us
- Sign up for alerts
- Published: 20 April 2022

Agriculture and climate change are reshaping insect biodiversity worldwide
- Charlotte L. Outhwaite ORCID: orcid.org/0000-0001-9997-6780 1 na1 ,
- Peter McCann ORCID: orcid.org/0000-0002-1298-6482 1 na1 &
- Tim Newbold 1
Nature volume 605 , pages 97–102 ( 2022 ) Cite this article
26k Accesses
133 Citations
3778 Altmetric
Metrics details
- Biodiversity
- Climate-change ecology
- Macroecology
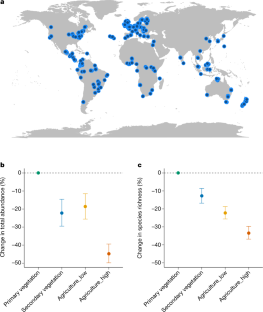
Several previous studies have investigated changes in insect biodiversity, with some highlighting declines and others showing turnover in species composition without net declines 1 , 2 , 3 , 4 , 5 . Although research has shown that biodiversity changes are driven primarily by land-use change and increasingly by climate change 6 , 7 , the potential for interaction between these drivers and insect biodiversity on the global scale remains unclear. Here we show that the interaction between indices of historical climate warming and intensive agricultural land use is associated with reductions of almost 50% in the abundance and 27% in the number of species within insect assemblages relative to those in less-disturbed habitats with lower rates of historical climate warming. These patterns are particularly evident in the tropical realm, whereas some positive responses of biodiversity to climate change occur in non-tropical regions in natural habitats. A high availability of nearby natural habitat often mitigates reductions in insect abundance and richness associated with agricultural land use and substantial climate warming but only in low-intensity agricultural systems. In such systems, in which high levels (75% cover) of natural habitat are available, abundance and richness were reduced by 7% and 5%, respectively, compared with reductions of 63% and 61% in places where less natural habitat is present (25% cover). Our results show that insect biodiversity will probably benefit from mitigating climate change, preserving natural habitat within landscapes and reducing the intensity of agriculture.
This is a preview of subscription content, access via your institution
Access options
Access Nature and 54 other Nature Portfolio journals
Get Nature+, our best-value online-access subscription
24,99 € / 30 days
cancel any time
Subscribe to this journal
Receive 51 print issues and online access
185,98 € per year
only 3,65 € per issue
Rent or buy this article
Prices vary by article type
Prices may be subject to local taxes which are calculated during checkout

Relationship of insect biomass and richness with land use along a climate gradient
Johannes Uhler, Sarah Redlich, … Jörg Müller

Different roles of concurring climate and regional land-use changes in past 40 years’ insect trends
Felix Neff, Fränzi Korner-Nievergelt, … Eva Knop

Insect diversity is a good indicator of biodiversity status in Africa
Tobias Landmann, Michael Schmitt, … Henri E. Z. Tonnang
Data availability
The 2016 release of the PREDICTS database used in this study can be downloaded from the data portal of the Natural History Museum at https://data.nhm.ac.uk/dataset/the-2016-release-of-the-predicts-database . The CRU TS data used for calculating the temperature anomalies can be downloaded from the CRU data website at https://crudata.uea.ac.uk/cru/data/hrg/ . The data from ref. 34 , including the primary and secondary vegetation layers that were combined into the natural habitat layer, can be downloaded from the Commonwealth Scientific and Industrial Research Organisation data access portal at https://doi.org/10.4225/08/56DCD9249B224 .
Code availability
The code required to run the analyses presented here can be obtained from the GitHub repository at https://github.com/timnewbold/LanduseClimateInsects.
Lister, B. C. & Garcia, A. Climate-driven declines in arthropod abundance restructure a rainforest food web. Proc. Natl Acad. Sci. USA 115 , E10397–E10406 (2018).
Article CAS PubMed PubMed Central Google Scholar
Soroye, P., Newbold, T. & Kerr, J. Climate change contributes to widespread declines among bumble bees across continents. Science 367 , 685–688 (2020).
Article CAS PubMed ADS Google Scholar
Outhwaite, C. L., Gregory, R. D., Chandler, R. E., Collen, B. & Isaac, N. J. B. Complex long-term biodiversity change among invertebrates, bryophytes and lichens. Nat. Ecol. Evol. 4 , 384–392 (2020).
Article PubMed Google Scholar
Crossley, M. S. et al. No net insect abundance and diversity declines across US long term ecological research sites. Nat. Ecol. Evol. 4 , 1368–1376 (2020).
Janzen, D. H. & Hallwachs, W. To us insectometers, it is clear that insect decline in our Costa Rican tropics is real, so let’s be kind to the survivors. Proc. Natl Acad. Sci. USA 118 , e2002546117 (2021).
Newbold, T. et al. Global effects of land use on local terrestrial biodiversity. Nature 520 , 45–50 (2015).
Spooner, F. E. B., Pearson, R. G. & Freeman, R. Rapid warming is associated with population decline among terrestrial birds and mammals globally. Glob. Change Biol. 24 , 4521–4531 (2018).
Article ADS Google Scholar
Powney, G. D. et al. Widespread losses of pollinating insects in Britain. Nat. Commun. 10 , 1018 (2019).
Article PubMed PubMed Central ADS CAS Google Scholar
van Klink, R. et al. Meta-analysis reveals declines in terrestrial but increases in freshwater insect abundances. Science 368 , 417–420 (2020).
Article PubMed ADS CAS Google Scholar
Yang, L. H. & Gratton, C. Insects as drivers of ecosystem processes. Curr. Opin. Insect Sci. 2 , 26–32 (2014).
Dainese, M. et al. A global synthesis reveals biodiversity-mediated benefits for crop production. Sci. Adv. 5 , eaax0121 (2019).
Article PubMed PubMed Central ADS Google Scholar
Halsch, C. A. et al. Insects and recent climate change. Proc. Natl. Acad. Sci. USA 118 , e2002543117 (2021).
Wagner, D. L., Fox, R., Salcido, D. M. & Dyer, L. A. A window to the world of global insect declines: moth biodiversity trends are complex and heterogeneous. Proc. Natl Acad. Sci. USA 118 , e2002549117 (2021).
Maxwell, S. L., Fuller, R. A., Brooks, T. M. & Watson, J. E. M. Biodiversity: the ravages of guns, nets and bulldozers. Nature 536 , 143–145 (2016).
Kerr, J. T. et al. Climate change impacts on bumblebees converge across continents. Science 349 , 177–180 (2015).
Uhler, J. et al. Relationship of insect biomass and richness with land use along a climate gradient. Nat. Commun. 12 , 5946 (2021).
Article CAS PubMed PubMed Central ADS Google Scholar
Oliver, T. H. & Morecroft, M. D. Interactions between climate change and land use change on biodiversity: attribution problems, risks, and opportunities. Wiley Interdiscip. Rev. Clim. Change 5 , 317–335 (2014).
Article Google Scholar
Williams, J. J. & Newbold, T. Local climatic changes affect biodiversity responses to land use: a review. Divers. Distrib. 26 , 76–92 (2020).
González del Pliego, P. et al. Thermally buffered microhabitats recovery in tropical secondary forests following land abandonment. Biol. Conserv. 201 , 385–395 (2016).
Senior, R. A., Hill, J. K., González del Pliego, P., Goode, L. K. & Edwards, D. P. A pantropical analysis of the impacts of forest degradation and conversion on local temperature. Ecol. Evol. 7 , 7897–7908 (2017).
Article PubMed PubMed Central Google Scholar
Peters, M. K. et al. Climate–land-use interactions shape tropical mountain biodiversity and ecosystem functions. Nature 568 , 88–92 (2019).
Mantyka-Pringle, C. S., Martin, T. G. & Rhodes, J. R. Interactions between climate and habitat loss effects on biodiversity: a systematic review and meta-analysis. Glob. Change Biol. 18 , 1239–1252 (2012).
Northrup, J. M., Rivers, J. W., Yang, Z. & Betts, M. G. Synergistic effects of climate and land-use change influence broad-scale avian population declines. Glob. Change Biol. 25 , 1561–1575 (2019).
Deutsch, C. A. et al. Impacts of climate warming on terrestrial ectotherms across latitude. Proc. Natl Acad. Sci. USA 105 , 6668–6672 (2008).
Newbold, T., Oppenheimer, P., Etard, A. & Williams, J. J. Tropical and Mediterranean biodiversity is disproportionately sensitive to land-use and climate change. Nat. Ecol. Evol. 4 , 1630–1638 (2020).
Perez, T. M., Stroud, J. T. & Feeley, K. J. Thermal trouble in the tropics. Science 351 , 1392–1393 (2016).
Betts, M. G., Phalan, B., Frey, S. J. K., Rousseau, J. S. & Yang, Z. Old-growth forests buffer climate-sensitive bird populations from warming. Divers. Distrib. 24 , 439–447 (2018).
Hendershot, J. N. et al. Intensive farming drives long-term shifts in avian community composition. Nature 579 , 393–396 (2020).
Tscharntke, T. et al. Landscape moderation of biodiversity patterns and processes - eight hypotheses. Biol. Rev. 87 , 661–685 (2012).
Suggitt, A. J. et al. Extinction risk from climate change is reduced by microclimatic buffering. Nat. Clim. Change 8 , 713–717 (2018).
Hudson, L. N. et al. The database of the PREDICTS (Projecting Responses of Ecological Diversity in Changing Terrestrial Systems) project. Ecol. Evol. 7 , 145–188 (2017).
Harris, I., Osborn, T. J., Jones, P. & Lister, D. Version 4 of the CRU TS monthly high-resolution gridded multivariate climate dataset. Sci. Data 7 , 109 (2020).
Johansson, F., Orizaola, G. & Nilsson-Örtman, V. Temperate insects with narrow seasonal activity periods can be as vulnerable to climate change as tropical insect species. Sci. Rep. 10 , 8822 (2020).
Hoskins, A. J. et al. Downscaling land-use data to provide global 30′′ estimates of five land-use classes. Ecol. Evol. 6 , 3040–3055 (2016).
Grab, H. et al. Agriculturally dominated landscapes reduce bee phylogenetic diversity and pollination services. Science 363 , 282–284 (2019).
Rusch, A. et al. Agricultural landscape simplification reduces natural pest control: a quantitative synthesis. Agric. Ecosyst. Environ. 221 , 198–204 (2016).
Oliver, T. H. et al. Declining resilience of ecosystem functions under biodiversity loss. Nat. Commun. 6 , 10122 (2015).
Sunday, J. M. et al. Thermal-safety margins and the necessity of thermoregulatory behavior across latitude and elevation. Proc. Natl Acad. Sci. USA. 111 , 5610–5615 (2014).
Balmford, A. Extinction filters and current resilience: the significance of past selection pressures for conservation biology. Trends Ecol. Evol. 11 , 193–196 (1996).
Article CAS PubMed Google Scholar
Garibaldi, L. A. et al. Stability of pollination services decreases with isolation from natural areas despite honey bee visits. Ecol. Lett. 14 , 1062–1072 (2011).
Carvalheiro, L. G., Seymour, C. L., Veldtman, R. & Nicolson, S. W. Pollination services decline with distance from natural habitat even in biodiversity-rich areas. J. Appl. Ecol. 47 , 810–820 (2010).
Dainese, M., Luna, D. I., Sitzia, T. & Marini, L. Testing scale-dependent effects of seminatural habitats on farmland biodiversity. Ecol. Appl. 25 , 1681–1690 (2015).
Fourcade, Y. et al. Habitat amount and distribution modify community dynamics under climate change. Ecol. Lett. 24 , 950–957 (2021).
Alexander, L. V. et al. Global observed changes in daily climate extremes of temperature and precipitation. J. Geophys. Res. 111 , D05109 (2006).
ADS Google Scholar
Seibold, S. et al. Arthropod decline in grasslands and forests is associated with landscape-level drivers. Nature 574 , 671–674 (2019).
De Palma, A. et al. Dimensions of biodiversity loss: spatial mismatch in land-use impacts on species, functional and phylogenetic diversity of European bees. Divers. Distrib. 23 , 1435–1446 (2017).
Collen, B., Ram, M., Zamin, T. & McRae, L. The tropical biodiversity data gap: addressing disparity in global monitoring. Trop. Conserv. Sci. 1 , 75–88 (2008).
Menéndez, R. How are insects responding to global warming? Tijdschr. Entomol. 150 , 355 (2007).
Google Scholar
Bale, J. S. et al. Herbivory in global climate change research: direct effects of rising temperature on insect herbivores. Glob. Change Biol. 8 , 1–16 (2002).
Hudson, L. N. et al. The 2016 release of the PREDICTS database. Natural History Museum Data Portal, https://doi.org/10.5519/0066354 (2016).
Hudson, L. N. et al. The PREDICTS database: a global database of how local terrestrial biodiversity responds to human impacts. Ecol. Evol. 4 , 4701–4735 (2014).
De Palma, A. et al. Annual changes in the Biodiversity Intactness Index in tropical and subtropical forest biomes, 2001–2012. Sci. Rep. 11 , 20249 (2021).
Article PubMed PubMed Central CAS Google Scholar
Chao, A., Chazdon, R. L., Colwell, R. K. & Shen, T.-J. A new statistical approach for assessing similarity of species composition with incidence and abundance data. Ecol. Lett. 8 , 148–159 (2005).
Ndakidemi, B., Mtei, K. & Ndakidemi, P. A. Impacts of synthetic and botanical pesticides on beneficial insects. Agric. Sci. 07 , 364–372 (2016).
CAS Google Scholar
Wang, X., Hua, F., Wang, L., Wilcove, D. S. & Yu, D. W. The biodiversity benefit of native forests and mixed‐species plantations over monoculture plantations. Divers. Distrib. 25 , 1721–1735 (2019).
Weedon, G. P. et al. The WFDEI meteorological forcing data set: WATCH Forcing Data methodology applied to ERA-Interim reanalysis data. Water Resour. Res. 50 , 7505–7514 (2014).
Warszawski, L. et al. The inter-sectoral impact model intercomparison project (ISI-MIP): project framework. Proc. Natl Acad. Sci. USA 111 , 3228–3232 (2014).
van Vuuren, D. P. et al. The representative concentration pathways: an overview. Clim. Change 109 , 5–31 (2011).
New, M., Hulme, M. & Jones, P. Representing twentieth-century space–time climate variability. Part I: development of a 1961–90 mean monthly terrestrial climatology. J. Clim. 12 , 829–856 (1999).
Hijmans, R. J. Raster: Geographic data analysis and modelling. R package version 2.8-42018, https://CRAN.R-project.org/package=raster (2018).
Rigby, R. A., Stasinopoulos, D. M. & Akantziliotou, C. A framework for modelling overdispersed count data, including the Poisson-shifted generalized inverse Gaussian distribution. Comput. Stat. Data Anal. 53 , 381–393 (2008).
Article MathSciNet MATH Google Scholar
Bates, D., Maechler, M., Bolker, B. & Walker, S. Fitting linear mixed-effects models using lme4. J. Stat. Softw. 67 , 1–48 (2015).
Download references
Acknowledgements
This work was supported by UK Natural Environment Research Council grants (NE/R010811/1 and NE/V006533/1) and by a Royal Society University Research Fellowship to T.N.
Author information
These authors contributed equally: Charlotte L. Outhwaite, Peter McCann
Authors and Affiliations
Centre for Biodiversity and Environment Research, University College London, London, UK
Charlotte L. Outhwaite, Peter McCann & Tim Newbold
You can also search for this author in PubMed Google Scholar
Contributions
T.N. and P.M. conceived the study. All authors processed and analysed the data and wrote and edited the manuscript.
Corresponding author
Correspondence to Charlotte L. Outhwaite .
Ethics declarations
Competing interests.
The authors declare no competing interests.
Peer review
Peer review information.
Nature thanks Ian Harris, Robert Wilson and the other, anonymous, reviewer(s) for their contribution to the peer review of this work. Peer reviewer reports are available.
Additional information
Publisher’s note Springer Nature remains neutral with regard to jurisdictional claims in published maps and institutional affiliations.

Extended data figures and tables
Extended data fig 1 global average changes in absolute and standardised temperatures..
a. Absolute change in temperature between the baseline 1901-1930 and 2005 (the median sample year of the insect data). This was calculated as the difference in mean monthly temperatures of insect-active months between the baseline of 1901-1930 and the period 2004-2006 for each 0.5 × 0.5° grid cell of the terrestrial surface, for which estimates were available. b. The standardised temperature anomaly was calculated as the absolute temperate change between the baseline and 2005, divided by the standard deviation of the baseline temperatures across insect-active months (see Methods for more detail). For both absolute and standardised temperature changes, we consider only months in which insects are assumed to be active (i.e., monthly mean temperature ≥ 10 °C). Density plots to the right of each map show the average temperature change at a given latitude. Extreme latitudes and areas of high elevation are blank as they do not have months that meet the assumed temperature threshold for insect activity.
Extended Data Fig 2 Response of insect total abundance (a) and species richness (b) to the interaction between land use and the maximum temperature anomaly.
(Likelihood-ratio tests: abundance: \({\chi }_{3,11}^{2}=29\) , p <0.001; species richness: \({\chi }_{3,11}^{2}=21\) , p <0.001). Values represent the percentage difference compared to primary vegetation with no historic climate warming (a maximum temperature anomaly of 0). The maximum temperature anomaly is the difference in the average of the maximum temperatures in the three hottest months each year between the baseline of 1901-1930 and the five years preceding biodiversity sampling, divided by the standard deviation of the baseline monthly maximum temperatures (for the three hottest months per baseline year). Lines correspond to the median predicted value and shaded area represents the 95% confidence interval. Results are plotted for the central 95% of modelled anomaly values for each land use. Number of sites included in the analyses (abundance model, richness model) were: Primary vegetation (Primary) n = 1,458, 1,563; Secondary vegetation (Secondary) n = 1,338, 1,471; Low-intensity agriculture (Agriculture_Low) n = 1,479, 1,499; and High-intensity agriculture (Agriculture_High) n = 1,717, 1,775.
Extended Data Fig 3 Response of insect total abundance (a) and species richness (b) to the interaction between land use and the standardised temperature anomaly after influential studies were removed from the dataset.
Values represent the percentage difference compared to primary vegetation with no historical climate warming (a standardised temperature anomaly of 0). Details of the calculation of the standardised temperature anomaly are given in the legend of Fig. 2 . Lines correspond to the median predicted value and shaded area represents the 95% confidence interval. Results are plotted for the central 95% of modelled anomaly values for each land use. Number of sites removed: abundance, 361 sites; richness, 650 sites.
Extended Data Fig 4 Response of insect total abundance (a) and species richness (b) to the interaction between land use and the standardised maximum temperature anomaly after influential studies were removed from the dataset.
Values represent the percentage difference compared to primary vegetation with no historical climate warming (a maximum temperature anomaly of 0). Details of the calculation of the maximum temperature anomaly are given in the legend of Extended Data Fig. 2 . Lines correspond to the median predicted value and shaded area represents the 95% confidence interval. Results are plotted for the central 95% of modelled anomaly values for each land use. Number of sites removed: abundance, 409 sites; richness, 698 sites.
Extended Data Fig 5 Response of insect total abundance (a & b) and species richness (c & d) to the interaction between land use and the standardised maximum temperature anomaly in non-tropical (a & c) and tropical (b & d) realms.
(Likelihood-ratio tests: abundance: non-tropical \({\chi }_{3,11}^{2}=8\) , p = 0.05, tropical \({\chi }_{3,11}^{2}=24\) , p < 0.001; richness : non-tropical \({\chi }_{3,11}^{2}=68\) , p < 0.001, tropical \({\chi }_{3,11}^{2}=8.5\) , p < 0.05). Values represent the percentage difference compared to primary vegetation with no historical climate warming (a maximum temperature anomaly of 0). Details of the calculation of the maximum temperature anomaly are given in the legend of Extended Data Fig. 2 . Lines correspond to the median predicted value and shaded area represents the 95% confidence interval. Results are plotted for the central 95% of modelled anomaly values for each land use.
Extended Data Fig 6 Response of insect species richness to the interaction between the standardised maximum temperature anomaly, land-use intensity, and the amount of nearby natural habitat.
(Likelihood-ratio test: richness: \({\chi }_{3,13}^{2}=77.3\) , p < 0.001). a. Low-intensity agriculture and b. high-intensity agriculture. Lines correspond to the median predicted value and shaded area represents the 95% confidence interval, for sites with differing cover of natural habitat within a 5-km buffer. Values represent the percentage difference compared to primary vegetation with no historical climate warming (a standardised maximum temperature anomaly of 0), and with 100% nearby natural habitat. Details of the calculation of the maximum temperature anomaly are given in the legend of Extended Data Fig. 2 . The interaction was non-significant for total abundance ( p > 0.05) and is thus not presented here.
Extended Data Fig 7 Maps of the standardised temperature anomaly for the years 2018 and 2070 under RCP 8.5.
The standardised temperature anomaly was determined for each 0.5 × 0.5° grid cell of the global terrestrial land area. Based on data on monthly mean temperatures for 2016-2018, and projected temperatures for 2069-2071 under RCP 8.5 as a worst-case scenario should current ambitions to reduce emissions be unsuccessful (see Methods ). Negative values indicate a decrease in temperature compared to the historical baseline, while positive values indicate an increase in temperature. A value of 1 indicates warming equivalent to 1 standard deviation of monthly variation during the baseline period 1901-1930 (for insect-active months, i.e., monthly mean temperature ≥ 10 °C).
Supplementary information
Supplementary information.
This file contains Supplementary Methods, Figs. 1–31, Tables 1–22 and references. The Supplementary Methods include details on the sensitivity tests outlined in the main paper. Supplementary Tables 1–22 include dataset summaries and model output tables.
Reporting Summary
Peer review file, rights and permissions.
Reprints and permissions
About this article
Cite this article.
Outhwaite, C.L., McCann, P. & Newbold, T. Agriculture and climate change are reshaping insect biodiversity worldwide. Nature 605 , 97–102 (2022). https://doi.org/10.1038/s41586-022-04644-x
Download citation
Received : 19 March 2021
Accepted : 15 March 2022
Published : 20 April 2022
Issue Date : 05 May 2022
DOI : https://doi.org/10.1038/s41586-022-04644-x
Share this article
Anyone you share the following link with will be able to read this content:
Sorry, a shareable link is not currently available for this article.
Provided by the Springer Nature SharedIt content-sharing initiative
This article is cited by
Anthropogenic climate and land-use change drive short- and long-term biodiversity shifts across taxa.
- Teresa Montràs-Janer
- Andrew J. Suggitt
- Alistair G. Auffret
Nature Ecology & Evolution (2024)
Telecoupled impacts of the Russia–Ukraine war on global cropland expansion and biodiversity
- Jianguo Liu
Nature Sustainability (2024)
Past and recent anthropogenic pressures drive rapid changes in riverine fish communities
- Alain Danet
- Xingli Giam
Bee-Ing positive about wasp-negative media reporting: the opinions of scientists and their influence on the media
- R. L. Brown
Insectes Sociaux (2024)
Effects of food availability on butterfly diversity and network specialization across altitudinal levels in a Mediterranean landscape
- Jesús Sánchez-Dávila
- Anna Traveset
Biodiversity and Conservation (2024)
By submitting a comment you agree to abide by our Terms and Community Guidelines . If you find something abusive or that does not comply with our terms or guidelines please flag it as inappropriate.
Quick links
- Explore articles by subject
- Guide to authors
- Editorial policies
Sign up for the Nature Briefing newsletter — what matters in science, free to your inbox daily.

IMAGES
VIDEO
COMMENTS
Although research has shown that biodiversity changes are driven primarily by land-use change and increasingly by climate change 6,7, the potential for interaction between these drivers and insect ...