Peer Recognized
Make a name in academia

Research conference presentation slide template + 3 design tips
Imagine this: research conference organizers send the participants a PowerPoint presentation slide template along with instructions that sound something like this:
Your presentation should be 20 minutes long; please keep the number of presentation slides to a maximum of 20.
A scientist who has 35 PowerPoint slides from the previous conference and might think:
OK, no problem! I will simply squeeze the information from the remaining fifteen slides into the first twenty to fit the provided presentation template.
The resulting presentation slides probably look similar to the figure below.
The scientist arrives at the conference, delivers the presentation, and receives applause at the end. He puts a picture from the conference on a social network and receives a comment: Sorry, I missed your presentation. Please email me the slides.
Ahh, he thinks , it’s a good thing I jammed that extra information into the presentation slides. Otherwise, it would be difficult for the person asking to get the full overview of my work!
It seems everyone is happy. The conference organizers got their 20 slides, the presenter successfully delivered his speech, and even the person on social media got the information she requested. But one thing is missing from the story – what about the people who actually showed up for the presentation?
The listeners were probably bewildered by the PowerPoint slides resembling an explosion of a hard drive disc over the screen. Their eyes were darting to follow the laser pointer from a figure in one corner of the slide to bullet points in the other. At around the third slide, many probably started daydreaming about the appetizers they can expect during the coffee break. They energetically clapped their hands at the end of the presentation because it was finally over. They forgot the performance as soon as the next speaker took the stage.
OK, but what about the person that asked you to send her the slides? Surely she would be disappointed when receiving a presentation which she cannot understand without you being there to present it. Well, send her the research paper (see my book to learn writing an impactful research paper). This is the piece of work that is meant for sharing and has to be self-explanatory. You are on the stage for a reason! Research conference presentation slides do not have to be self-explanatory.
In this post, you will learn three crucial tips for preparing scientific conference presentation slides to efficiently explain your research.
Tip No.1: One thought per slide
Presenters often use slides to keep the talk on track. Frequently this takes the form of the dreaded bullet-point list. Such an approach is a bad idea. Despite what some people claim, humans can not multitask at things that require deliberate thinking. Too much text will draw the listener’s attention away from what you are saying and toward reading the text on the slide. Since we read faster than we can speak, your listeners will already know what you are going to say, thus losing their attention.
The best approach for keeping the presentation slides light is to limit yourself to one single thought per slide. This could be, for example, a figure and several supporting bullet points taking up not more than one row each. But do not be afraid only to have one item, like a diagram, on the slide which takes only ten seconds to explain. There is no invisible jar that will start to spill over if you pour too many slides inside. A single thought per slide will allow the audience to better follow the presentation. This will also allow you to increase the size of text and images, thus ensuring that people in the back row can follow the talk.
Instead of using presentation slides as a teleprompter, use this valuable real estate for information that adds to your presentation, not duplicates it.
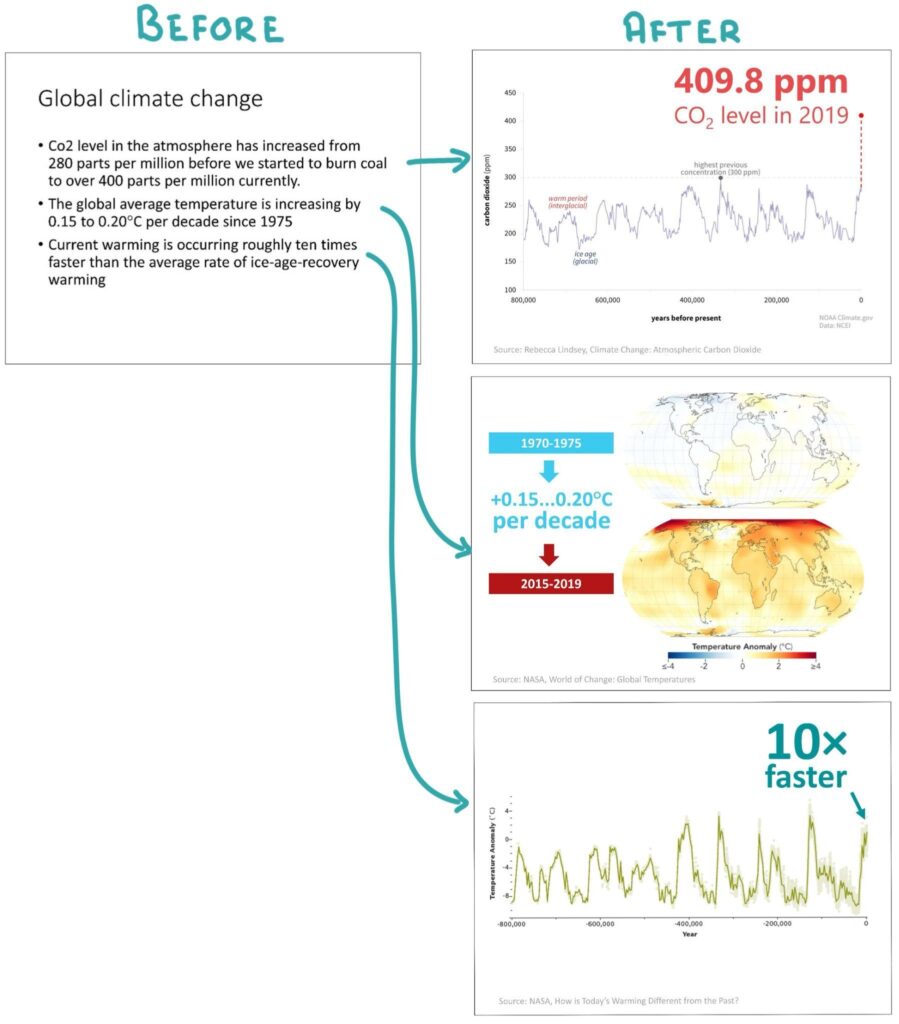
The “before” figure below presents a typical academic conference PowerPint presentation slide with three bullet points. I transformed it into three separate slides, each introducing one single thought. When displaying the “after” slides, the presenter would simply say out loud the information that was previously written.
You will notice that each of the converted slides uses visual information instead of text. Visuals draw human attention and can do a great job explaining things that would be difficult to put into words. Data charts, scientific illustrations, diagrams, or videos can all add another dimension to complement your presentation.
I am not claiming that you should strip your presentation slides of useful information or dumb them down. My reasoning stems from the vast majority of presentation slides that I have seen in research conferences. The slides are often overwhelmed with details that do more to confuse the listener than help. Focusing the slide content on visual information will help to support instead of distracting from your message. This brings us to the next topic.
Tip No.2: Presentation slides are for visual information
Even though I urge you to simplify the slides, it is clear that as a researcher, you will need to present complex information. This will most often take the form of different charts and illustrations (let’s call them graphics).
There is a lot to learn about the creation of graphics, but one element from the toolkit of designing graphics is particularly important for creating great scientific conference presentation slides. That is knowing how to guide the listeners’ attention. To do it, we must tap into a basic human instinct – people are drawn to outliers. Back at the dawn of homo-sapiens, this helped us spot danger or notice prey: think of a lion moving in a steppe – it is easy to imagine why our vision has evolved to pay attention to it.
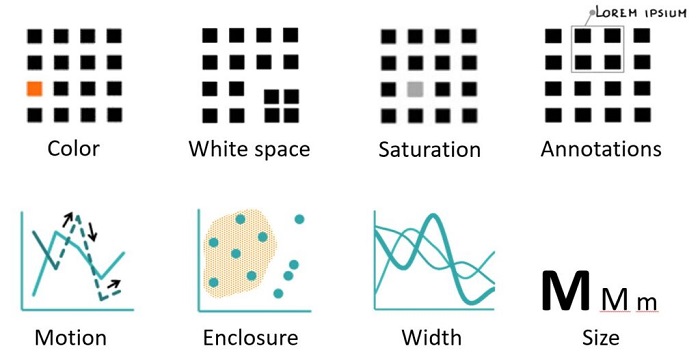
Today we can take advantage of the 300 thousand-year-old instincts of our species to explain the all-important differences between two lines in a graph. Color, size, motion, white space, enclosure, and shape are some graphical features that can attract attention to particular elements in a chart.
Learn creating charts that tell a story
Knowing how to prepare efficient data charts and graphics will not only help you to create better slides; you will be able to use these skills to write clearer research papers and certainly it will increase your chances of obtaining research grants. My book Research Data Visualization and Scientific Graphics is a short guide that will help you to learn create charts that tell a story.
The example below directs the attention of the viewers within a single chart to the different topics that are being discussed (data from Evans et al. ). These could be presented in sequential slides.
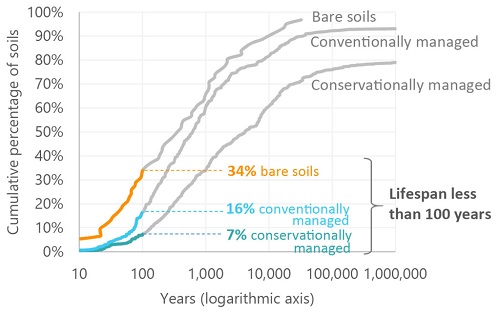
The “Only 60 harvests ” left claims are exaggerated. Research by Evans et al. shows that depending on the soil management, only 7-34% of soils have less than 100 year lifespan.
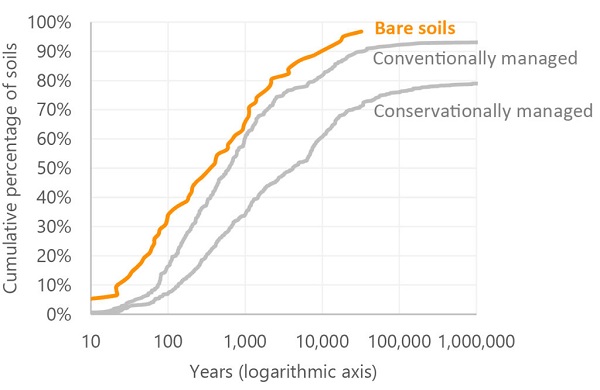
Even most bare soils survive upwards of 300 years.
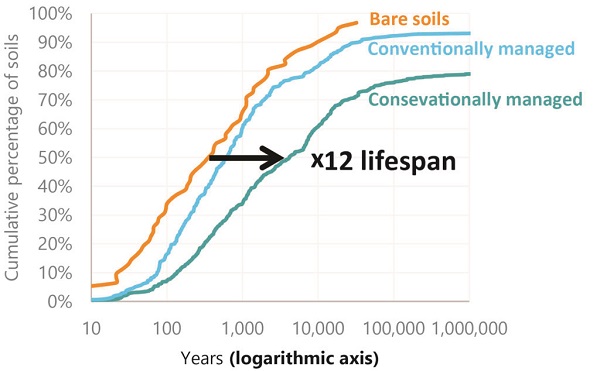
A good management practice can extend the soil’s life by several orders of magnitude.
A word of caution for those who might become too trigger-happy when discovering how easy it is to add animations to PowerPoint presentation slides: use these effects only when they add information to the story that you are telling. It quickly becomes irritating to see flying text, rotating slide transitions, expanding bullet points, and dissolving pictures. Revealing only one item at a time can be similarly annoying when done without a purpose.
Hint: Avoid using PowerPoint templates with busy backgrounds or colorful university logos on each slide. This limits your ability to draw the listeners’ attention to a particular item on the slide. On a busy background, the highlighted parts will not pop out quite as much as they would from a simple background.
Tip No.3: Use action titles
Instinctively we can probably agree that the most important information, regardless of the type of medium, should be the largest. For example, it would be weird if the largest letters on a milk bottle would rea “Recyclable”. Interestingly, almost none of us actually follow this logic when designing scientific conference presentation slides.
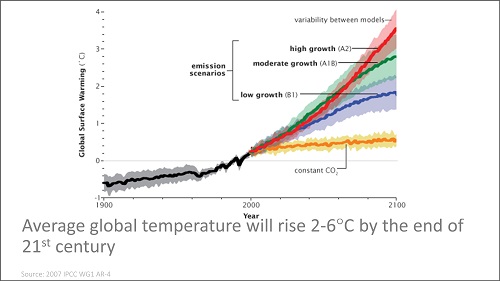
If you open PowerPoint, by default the largest text is the slide title. Since it is also located at the top of the slide, the title is going to be the first thing that draws the listener’s attention. But what do we put up there? Redundant, meaningless phrases like Methodology or Results of XYZ test . The figure below provides one such example.
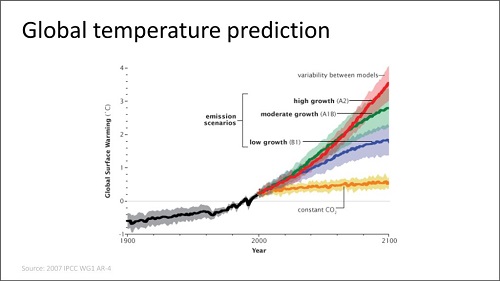
The traditional PowerPoint title attracts all the attention while providing very little information.
You will probably agree that the tile Global temperature prediction does little to reveal what’s important about the information in the presentation slide. That is unless the listener has suddenly awoken from a nap and wants to understand what is the topic you are currently discussing. If this is the case, slide titles are the least of your problems.
Instead of wasting the title for redundant information, a much better idea is to follow the advice from the C.N.Knaflic’s book Storytelling with Data in using an action title . An action title should provide information about the results, highlight an important observation or a conclusion for the particular slide. For example, instead of a whole block of slides having the title Results , the individual slide titles would say Observations have high variability or Simulation supports the test results .
In other words, a conference slide title should present something important about the research that the audience should not miss. It sets the expectations for what to expect from the information on the slide.
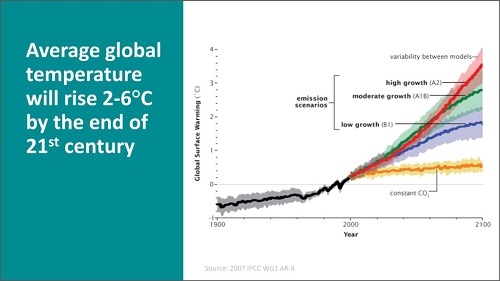
See below the different ways in which an action title can be displayed in the presentation slides. Doesn’t this approach offer more information than the traditional PowerPoint slide title that we saw earlier?
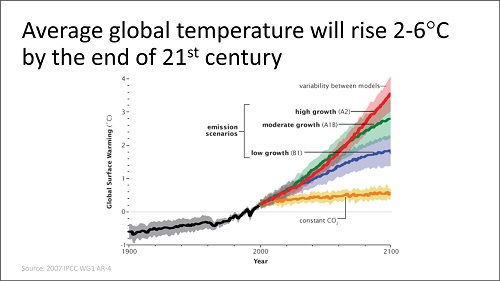
An action title highlights the key information that the listeners should not miss
Placing the action title at the bottom (and graying it out) is another option, giving more emphasis to the slide content.
The widescreen (16:9) slide size can be put to good use by dividing it into two columns: one for visual information, the other for key text.
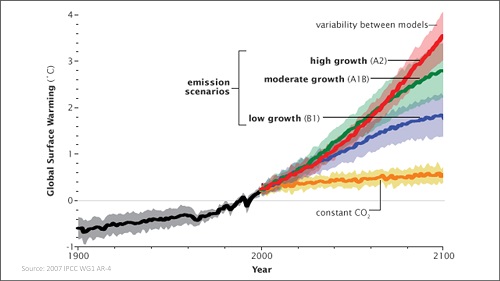
Removing the title altogether allows increasing the size of the graphics. The presenter tells all the information that was previously written in the slide title.

Font size rule of thumb : Make sure that the listeners in the back rows can read your slides comfortably. Since you will rarely have the chance to test this, apply the rule of thumb by using 14 to 28 pt. font size for the main text and in charts. References and other background information could be smaller and grayed out to avoid distracting from the main content.
A free scientific conference presentation slide template
Now that we have reviewed three key principles of academic conference presentation slide design, use them to prepare your own slides. An even better way is to prepare a PowerPoint slide template that automatically incorporates many of these tips.
Below you will find a free PowerPoint template that I designed specifically for scientific conference presentations. It holds six preformatted slide layouts which by default follow many of the academic conference slide design tips that we just went through, including the use of action titles, focus on visual information, and large enough font size. The presentation template also holds the three design tips to serve as a reminder from this post.

You will access these free Powerpoint scientific presentation slide templates in the download
Great slides will not mask poor presentation skills
Creating great presentation slides is certainly important in order to make a memorable academic presentation. But no amount of slide polishing will mask other potential problems, including lack of substance, unclear presentation structure, and a presenter who is so stressed their mouth feels like a desert.
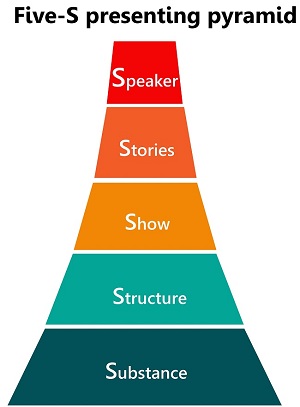
What you need is to add presentation skills to your scientific skill tool belt. My name is Martins Zaumanis and with my online course “Scientific Presentations Masterclass” I will show you how to become a masterful presenter using a system that I developed, called the “ Five S presenting pyramid ”.
Learn to give powerful academic presentations and overcome stage fright using the Five-S pyramid.

The Five-S pyramid starts from the basics of putting together the presentation Substance (first S), advances to devising a presentation Structure (second S), shows how to put up a Show (third S), tell memorable Stories (fourth S), and finally, it will offer advice for how the Speaker (fifth S) can work on improving presentation skills, including dealing with stage fright.
The Five-S pyramid starts from the basics of putting together the presentation Substance (first S), advances to devising a presentation Structure (second S), shows how to put up a Show (third S), tell memorable Stories (fourth S), and finally, it will offer advice for how the Speaker (fifth S) can work on improving presentation skills, including dealing with stage fright.
Related articles:

Leave a Reply Cancel reply
Your email address will not be published. Required fields are marked *
I want to join the Peer Recognized newsletter!
This site uses Akismet to reduce spam. Learn how your comment data is processed .
Privacy Overview
Copyright © 2024 Martins Zaumanis
Contacts: [email protected]
Privacy Policy

- Publication Recognition
How to Make a PowerPoint Presentation of Your Research Paper
- 4 minute read
- 117.5K views
Table of Contents
A research paper presentation is often used at conferences and in other settings where you have an opportunity to share your research, and get feedback from your colleagues. Although it may seem as simple as summarizing your research and sharing your knowledge, successful research paper PowerPoint presentation examples show us that there’s a little bit more than that involved.
In this article, we’ll highlight how to make a PowerPoint presentation from a research paper, and what to include (as well as what NOT to include). We’ll also touch on how to present a research paper at a conference.
Purpose of a Research Paper Presentation
The purpose of presenting your paper at a conference or forum is different from the purpose of conducting your research and writing up your paper. In this setting, you want to highlight your work instead of including every detail of your research. Likewise, a presentation is an excellent opportunity to get direct feedback from your colleagues in the field. But, perhaps the main reason for presenting your research is to spark interest in your work, and entice the audience to read your research paper.
So, yes, your presentation should summarize your work, but it needs to do so in a way that encourages your audience to seek out your work, and share their interest in your work with others. It’s not enough just to present your research dryly, to get information out there. More important is to encourage engagement with you, your research, and your work.
Tips for Creating Your Research Paper Presentation
In addition to basic PowerPoint presentation recommendations, which we’ll cover later in this article, think about the following when you’re putting together your research paper presentation:
- Know your audience : First and foremost, who are you presenting to? Students? Experts in your field? Potential funders? Non-experts? The truth is that your audience will probably have a bit of a mix of all of the above. So, make sure you keep that in mind as you prepare your presentation.
Know more about: Discover the Target Audience .
- Your audience is human : In other words, they may be tired, they might be wondering why they’re there, and they will, at some point, be tuning out. So, take steps to help them stay interested in your presentation. You can do that by utilizing effective visuals, summarize your conclusions early, and keep your research easy to understand.
- Running outline : It’s not IF your audience will drift off, or get lost…it’s WHEN. Keep a running outline, either within the presentation or via a handout. Use visual and verbal clues to highlight where you are in the presentation.
- Where does your research fit in? You should know of work related to your research, but you don’t have to cite every example. In addition, keep references in your presentation to the end, or in the handout. Your audience is there to hear about your work.
- Plan B : Anticipate possible questions for your presentation, and prepare slides that answer those specific questions in more detail, but have them at the END of your presentation. You can then jump to them, IF needed.
What Makes a PowerPoint Presentation Effective?
You’ve probably attended a presentation where the presenter reads off of their PowerPoint outline, word for word. Or where the presentation is busy, disorganized, or includes too much information. Here are some simple tips for creating an effective PowerPoint Presentation.
- Less is more: You want to give enough information to make your audience want to read your paper. So include details, but not too many, and avoid too many formulas and technical jargon.
- Clean and professional : Avoid excessive colors, distracting backgrounds, font changes, animations, and too many words. Instead of whole paragraphs, bullet points with just a few words to summarize and highlight are best.
- Know your real-estate : Each slide has a limited amount of space. Use it wisely. Typically one, no more than two points per slide. Balance each slide visually. Utilize illustrations when needed; not extraneously.
- Keep things visual : Remember, a PowerPoint presentation is a powerful tool to present things visually. Use visual graphs over tables and scientific illustrations over long text. Keep your visuals clean and professional, just like any text you include in your presentation.
Know more about our Scientific Illustrations Services .
Another key to an effective presentation is to practice, practice, and then practice some more. When you’re done with your PowerPoint, go through it with friends and colleagues to see if you need to add (or delete excessive) information. Double and triple check for typos and errors. Know the presentation inside and out, so when you’re in front of your audience, you’ll feel confident and comfortable.
How to Present a Research Paper
If your PowerPoint presentation is solid, and you’ve practiced your presentation, that’s half the battle. Follow the basic advice to keep your audience engaged and interested by making eye contact, encouraging questions, and presenting your information with enthusiasm.
We encourage you to read our articles on how to present a scientific journal article and tips on giving good scientific presentations .
Language Editing Plus
Improve the flow and writing of your research paper with Language Editing Plus. This service includes unlimited editing, manuscript formatting for the journal of your choice, reference check and even a customized cover letter. Learn more here , and get started today!

- Manuscript Preparation
Know How to Structure Your PhD Thesis

- Research Process
Systematic Literature Review or Literature Review?
You may also like.

What is a Good H-index?

What is a Corresponding Author?

How to Submit a Paper for Publication in a Journal
Input your search keywords and press Enter.
Reference management. Clean and simple.
How to make a scientific presentation

Scientific presentation outlines
Questions to ask yourself before you write your talk, 1. how much time do you have, 2. who will you speak to, 3. what do you want the audience to learn from your talk, step 1: outline your presentation, step 2: plan your presentation slides, step 3: make the presentation slides, slide design, text elements, animations and transitions, step 4: practice your presentation, final thoughts, frequently asked questions about preparing scientific presentations, related articles.
A good scientific presentation achieves three things: you communicate the science clearly, your research leaves a lasting impression on your audience, and you enhance your reputation as a scientist.
But, what is the best way to prepare for a scientific presentation? How do you start writing a talk? What details do you include, and what do you leave out?
It’s tempting to launch into making lots of slides. But, starting with the slides can mean you neglect the narrative of your presentation, resulting in an overly detailed, boring talk.
The key to making an engaging scientific presentation is to prepare the narrative of your talk before beginning to construct your presentation slides. Planning your talk will ensure that you tell a clear, compelling scientific story that will engage the audience.
In this guide, you’ll find everything you need to know to make a good oral scientific presentation, including:
- The different types of oral scientific presentations and how they are delivered;
- How to outline a scientific presentation;
- How to make slides for a scientific presentation.
Our advice results from delving into the literature on writing scientific talks and from our own experiences as scientists in giving and listening to presentations. We provide tips and best practices for giving scientific talks in a separate post.
There are two main types of scientific talks:
- Your talk focuses on a single study . Typically, you tell the story of a single scientific paper. This format is common for short talks at contributed sessions in conferences.
- Your talk describes multiple studies. You tell the story of multiple scientific papers. It is crucial to have a theme that unites the studies, for example, an overarching question or problem statement, with each study representing specific but different variations of the same theme. Typically, PhD defenses, invited seminars, lectures, or talks for a prospective employer (i.e., “job talks”) fall into this category.
➡️ Learn how to prepare an excellent thesis defense
The length of time you are allotted for your talk will determine whether you will discuss a single study or multiple studies, and which details to include in your story.
The background and interests of your audience will determine the narrative direction of your talk, and what devices you will use to get their attention. Will you be speaking to people specializing in your field, or will the audience also contain people from disciplines other than your own? To reach non-specialists, you will need to discuss the broader implications of your study outside your field.
The needs of the audience will also determine what technical details you will include, and the language you will use. For example, an undergraduate audience will have different needs than an audience of seasoned academics. Students will require a more comprehensive overview of background information and explanations of jargon but will need less technical methodological details.
Your goal is to speak to the majority. But, make your talk accessible to the least knowledgeable person in the room.
This is called the thesis statement, or simply the “take-home message”. Having listened to your talk, what message do you want the audience to take away from your presentation? Describe the main idea in one or two sentences. You want this theme to be present throughout your presentation. Again, the thesis statement will depend on the audience and the type of talk you are giving.
Your thesis statement will drive the narrative for your talk. By deciding the take-home message you want to convince the audience of as a result of listening to your talk, you decide how the story of your talk will flow and how you will navigate its twists and turns. The thesis statement tells you the results you need to show, which subsequently tells you the methods or studies you need to describe, which decides the angle you take in your introduction.
➡️ Learn how to write a thesis statement
The goal of your talk is that the audience leaves afterward with a clear understanding of the key take-away message of your research. To achieve that goal, you need to tell a coherent, logical story that conveys your thesis statement throughout the presentation. You can tell your story through careful preparation of your talk.
Preparation of a scientific presentation involves three separate stages: outlining the scientific narrative, preparing slides, and practicing your delivery. Making the slides of your talk without first planning what you are going to say is inefficient.
Here, we provide a 4 step guide to writing your scientific presentation:
- Outline your presentation
- Plan your presentation slides
- Make the presentation slides
- Practice your presentation

Writing an outline helps you consider the key pieces of your talk and how they fit together from the beginning, preventing you from forgetting any important details. It also means you avoid changing the order of your slides multiple times, saving you time.
Plan your talk as discrete sections. In the table below, we describe the sections for a single study talk vs. a talk discussing multiple studies:
The following tips apply when writing the outline of a single study talk. You can easily adapt this framework if you are writing a talk discussing multiple studies.
Introduction: Writing the introduction can be the hardest part of writing a talk. And when giving it, it’s the point where you might be at your most nervous. But preparing a good, concise introduction will settle your nerves.
The introduction tells the audience the story of why you studied your topic. A good introduction succinctly achieves four things, in the following order.
- It gives a broad perspective on the problem or topic for people in the audience who may be outside your discipline (i.e., it explains the big-picture problem motivating your study).
- It describes why you did the study, and why the audience should care.
- It gives a brief indication of how your study addressed the problem and provides the necessary background information that the audience needs to understand your work.
- It indicates what the audience will learn from the talk, and prepares them for what will come next.
A good introduction not only gives the big picture and motivations behind your study but also concisely sets the stage for what the audience will learn from the talk (e.g., the questions your work answers, and/or the hypotheses that your work tests). The end of the introduction will lead to a natural transition to the methods.
Give a broad perspective on the problem. The easiest way to start with the big picture is to think of a hook for the first slide of your presentation. A hook is an opening that gets the audience’s attention and gets them interested in your story. In science, this might take the form of a why, or a how question, or it could be a statement about a major problem or open question in your field. Other examples of hooks include quotes, short anecdotes, or interesting statistics.
Why should the audience care? Next, decide on the angle you are going to take on your hook that links to the thesis of your talk. In other words, you need to set the context, i.e., explain why the audience should care. For example, you may introduce an observation from nature, a pattern in experimental data, or a theory that you want to test. The audience must understand your motivations for the study.
Supplementary details. Once you have established the hook and angle, you need to include supplementary details to support them. For example, you might state your hypothesis. Then go into previous work and the current state of knowledge. Include citations of these studies. If you need to introduce some technical methodological details, theory, or jargon, do it here.
Conclude your introduction. The motivation for the work and background information should set the stage for the conclusion of the introduction, where you describe the goals of your study, and any hypotheses or predictions. Let the audience know what they are going to learn.
Methods: The audience will use your description of the methods to assess the approach you took in your study and to decide whether your findings are credible. Tell the story of your methods in chronological order. Use visuals to describe your methods as much as possible. If you have equations, make sure to take the time to explain them. Decide what methods to include and how you will show them. You need enough detail so that your audience will understand what you did and therefore can evaluate your approach, but avoid including superfluous details that do not support your main idea. You want to avoid the common mistake of including too much data, as the audience can read the paper(s) later.
Results: This is the evidence you present for your thesis. The audience will use the results to evaluate the support for your main idea. Choose the most important and interesting results—those that support your thesis. You don’t need to present all the results from your study (indeed, you most likely won’t have time to present them all). Break down complex results into digestible pieces, e.g., comparisons over multiple slides (more tips in the next section).
Summary: Summarize your main findings. Displaying your main findings through visuals can be effective. Emphasize the new contributions to scientific knowledge that your work makes.
Conclusion: Complete the circle by relating your conclusions to the big picture topic in your introduction—and your hook, if possible. It’s important to describe any alternative explanations for your findings. You might also speculate on future directions arising from your research. The slides that comprise your conclusion do not need to state “conclusion”. Rather, the concluding slide title should be a declarative sentence linking back to the big picture problem and your main idea.
It’s important to end well by planning a strong closure to your talk, after which you will thank the audience. Your closing statement should relate to your thesis, perhaps by stating it differently or memorably. Avoid ending awkwardly by memorizing your closing sentence.
By now, you have an outline of the story of your talk, which you can use to plan your slides. Your slides should complement and enhance what you will say. Use the following steps to prepare your slides.
- Write the slide titles to match your talk outline. These should be clear and informative declarative sentences that succinctly give the main idea of the slide (e.g., don’t use “Methods” as a slide title). Have one major idea per slide. In a YouTube talk on designing effective slides , researcher Michael Alley shows examples of instructive slide titles.
- Decide how you will convey the main idea of the slide (e.g., what figures, photographs, equations, statistics, references, or other elements you will need). The body of the slide should support the slide’s main idea.
- Under each slide title, outline what you want to say, in bullet points.
In sum, for each slide, prepare a title that summarizes its major idea, a list of visual elements, and a summary of the points you will make. Ensure each slide connects to your thesis. If it doesn’t, then you don’t need the slide.
Slides for scientific presentations have three major components: text (including labels and legends), graphics, and equations. Here, we give tips on how to present each of these components.
- Have an informative title slide. Include the names of all coauthors and their affiliations. Include an attractive image relating to your study.
- Make the foreground content of your slides “pop” by using an appropriate background. Slides that have white backgrounds with black text work well for small rooms, whereas slides with black backgrounds and white text are suitable for large rooms.
- The layout of your slides should be simple. Pay attention to how and where you lay the visual and text elements on each slide. It’s tempting to cram information, but you need lots of empty space. Retain space at the sides and bottom of your slides.
- Use sans serif fonts with a font size of at least 20 for text, and up to 40 for slide titles. Citations can be in 14 font and should be included at the bottom of the slide.
- Use bold or italics to emphasize words, not underlines or caps. Keep these effects to a minimum.
- Use concise text . You don’t need full sentences. Convey the essence of your message in as few words as possible. Write down what you’d like to say, and then shorten it for the slide. Remove unnecessary filler words.
- Text blocks should be limited to two lines. This will prevent you from crowding too much information on the slide.
- Include names of technical terms in your talk slides, especially if they are not familiar to everyone in the audience.
- Proofread your slides. Typos and grammatical errors are distracting for your audience.
- Include citations for the hypotheses or observations of other scientists.
- Good figures and graphics are essential to sustain audience interest. Use graphics and photographs to show the experiment or study system in action and to explain abstract concepts.
- Don’t use figures straight from your paper as they may be too detailed for your talk, and details like axes may be too small. Make new versions if necessary. Make them large enough to be visible from the back of the room.
- Use graphs to show your results, not tables. Tables are difficult for your audience to digest! If you must present a table, keep it simple.
- Label the axes of graphs and indicate the units. Label important components of graphics and photographs and include captions. Include sources for graphics that are not your own.
- Explain all the elements of a graph. This includes the axes, what the colors and markers mean, and patterns in the data.
- Use colors in figures and text in a meaningful, not random, way. For example, contrasting colors can be effective for pointing out comparisons and/or differences. Don’t use neon colors or pastels.
- Use thick lines in figures, and use color to create contrasts in the figures you present. Don’t use red/green or red/blue combinations, as color-blind audience members can’t distinguish between them.
- Arrows or circles can be effective for drawing attention to key details in graphs and equations. Add some text annotations along with them.
- Write your summary and conclusion slides using graphics, rather than showing a slide with a list of bullet points. Showing some of your results again can be helpful to remind the audience of your message.
- If your talk has equations, take time to explain them. Include text boxes to explain variables and mathematical terms, and put them under each term in the equation.
- Combine equations with a graphic that shows the scientific principle, or include a diagram of the mathematical model.
- Use animations judiciously. They are helpful to reveal complex ideas gradually, for example, if you need to make a comparison or contrast or to build a complicated argument or figure. For lists, reveal one bullet point at a time. New ideas appearing sequentially will help your audience follow your logic.
- Slide transitions should be simple. Silly ones distract from your message.
- Decide how you will make the transition as you move from one section of your talk to the next. For example, if you spend time talking through details, provide a summary afterward, especially in a long talk. Another common tactic is to have a “home slide” that you return to multiple times during the talk that reinforces your main idea or message. In her YouTube talk on designing effective scientific presentations , Stanford biologist Susan McConnell suggests using the approach of home slides to build a cohesive narrative.
To deliver a polished presentation, it is essential to practice it. Here are some tips.
- For your first run-through, practice alone. Pay attention to your narrative. Does your story flow naturally? Do you know how you will start and end? Are there any awkward transitions? Do animations help you tell your story? Do your slides help to convey what you are saying or are they missing components?
- Next, practice in front of your advisor, and/or your peers (e.g., your lab group). Ask someone to time your talk. Take note of their feedback and the questions that they ask you (you might be asked similar questions during your real talk).
- Edit your talk, taking into account the feedback you’ve received. Eliminate superfluous slides that don’t contribute to your takeaway message.
- Practice as many times as needed to memorize the order of your slides and the key transition points of your talk. However, don’t try to learn your talk word for word. Instead, memorize opening and closing statements, and sentences at key junctures in the presentation. Your presentation should resemble a serious but spontaneous conversation with the audience.
- Practicing multiple times also helps you hone the delivery of your talk. While rehearsing, pay attention to your vocal intonations and speed. Make sure to take pauses while you speak, and make eye contact with your imaginary audience.
- Make sure your talk finishes within the allotted time, and remember to leave time for questions. Conferences are particularly strict on run time.
- Anticipate questions and challenges from the audience, and clarify ambiguities within your slides and/or speech in response.
- If you anticipate that you could be asked questions about details but you don’t have time to include them, or they detract from the main message of your talk, you can prepare slides that address these questions and place them after the final slide of your talk.
➡️ More tips for giving scientific presentations
An organized presentation with a clear narrative will help you communicate your ideas effectively, which is essential for engaging your audience and conveying the importance of your work. Taking time to plan and outline your scientific presentation before writing the slides will help you manage your nerves and feel more confident during the presentation, which will improve your overall performance.
A good scientific presentation has an engaging scientific narrative with a memorable take-home message. It has clear, informative slides that enhance what the speaker says. You need to practice your talk many times to ensure you deliver a polished presentation.
First, consider who will attend your presentation, and what you want the audience to learn about your research. Tailor your content to their level of knowledge and interests. Second, create an outline for your presentation, including the key points you want to make and the evidence you will use to support those points. Finally, practice your presentation several times to ensure that it flows smoothly and that you are comfortable with the material.
Prepare an opening that immediately gets the audience’s attention. A common device is a why or a how question, or a statement of a major open problem in your field, but you could also start with a quote, interesting statistic, or case study from your field.
Scientific presentations typically either focus on a single study (e.g., a 15-minute conference presentation) or tell the story of multiple studies (e.g., a PhD defense or 50-minute conference keynote talk). For a single study talk, the structure follows the scientific paper format: Introduction, Methods, Results, Summary, and Conclusion, whereas the format of a talk discussing multiple studies is more complex, but a theme unifies the studies.
Ensure you have one major idea per slide, and convey that idea clearly (through images, equations, statistics, citations, video, etc.). The slide should include a title that summarizes the major point of the slide, should not contain too much text or too many graphics, and color should be used meaningfully.

Home Blog Presentation Ideas How to Create and Deliver a Research Presentation
How to Create and Deliver a Research Presentation

Every research endeavor ends up with the communication of its findings. Graduate-level research culminates in a thesis defense , while many academic and scientific disciplines are published in peer-reviewed journals. In a business context, PowerPoint research presentation is the default format for reporting the findings to stakeholders.
Condensing months of work into a few slides can prove to be challenging. It requires particular skills to create and deliver a research presentation that promotes informed decisions and drives long-term projects forward.
Table of Contents
What is a Research Presentation
Key slides for creating a research presentation, tips when delivering a research presentation, how to present sources in a research presentation, recommended templates to create a research presentation.
A research presentation is the communication of research findings, typically delivered to an audience of peers, colleagues, students, or professionals. In the academe, it is meant to showcase the importance of the research paper , state the findings and the analysis of those findings, and seek feedback that could further the research.
The presentation of research becomes even more critical in the business world as the insights derived from it are the basis of strategic decisions of organizations. Information from this type of report can aid companies in maximizing the sales and profit of their business. Major projects such as research and development (R&D) in a new field, the launch of a new product or service, or even corporate social responsibility (CSR) initiatives will require the presentation of research findings to prove their feasibility.
Market research and technical research are examples of business-type research presentations you will commonly encounter.
In this article, we’ve compiled all the essential tips, including some examples and templates, to get you started with creating and delivering a stellar research presentation tailored specifically for the business context.
Various research suggests that the average attention span of adults during presentations is around 20 minutes, with a notable drop in an engagement at the 10-minute mark . Beyond that, you might see your audience doing other things.
How can you avoid such a mistake? The answer lies in the adage “keep it simple, stupid” or KISS. We don’t mean dumbing down your content but rather presenting it in a way that is easily digestible and accessible to your audience. One way you can do this is by organizing your research presentation using a clear structure.
Here are the slides you should prioritize when creating your research presentation PowerPoint.
1. Title Page
The title page is the first thing your audience will see during your presentation, so put extra effort into it to make an impression. Of course, writing presentation titles and title pages will vary depending on the type of presentation you are to deliver. In the case of a research presentation, you want a formal and academic-sounding one. It should include:
- The full title of the report
- The date of the report
- The name of the researchers or department in charge of the report
- The name of the organization for which the presentation is intended
When writing the title of your research presentation, it should reflect the topic and objective of the report. Focus only on the subject and avoid adding redundant phrases like “A research on” or “A study on.” However, you may use phrases like “Market Analysis” or “Feasibility Study” because they help identify the purpose of the presentation. Doing so also serves a long-term purpose for the filing and later retrieving of the document.
Here’s a sample title page for a hypothetical market research presentation from Gillette .

2. Executive Summary Slide
The executive summary marks the beginning of the body of the presentation, briefly summarizing the key discussion points of the research. Specifically, the summary may state the following:
- The purpose of the investigation and its significance within the organization’s goals
- The methods used for the investigation
- The major findings of the investigation
- The conclusions and recommendations after the investigation
Although the executive summary encompasses the entry of the research presentation, it should not dive into all the details of the work on which the findings, conclusions, and recommendations were based. Creating the executive summary requires a focus on clarity and brevity, especially when translating it to a PowerPoint document where space is limited.
Each point should be presented in a clear and visually engaging manner to capture the audience’s attention and set the stage for the rest of the presentation. Use visuals, bullet points, and minimal text to convey information efficiently.

3. Introduction/ Project Description Slides
In this section, your goal is to provide your audience with the information that will help them understand the details of the presentation. Provide a detailed description of the project, including its goals, objectives, scope, and methods for gathering and analyzing data.
You want to answer these fundamental questions:
- What specific questions are you trying to answer, problems you aim to solve, or opportunities you seek to explore?
- Why is this project important, and what prompted it?
- What are the boundaries of your research or initiative?
- How were the data gathered?
Important: The introduction should exclude specific findings, conclusions, and recommendations.

4. Data Presentation and Analyses Slides
This is the longest section of a research presentation, as you’ll present the data you’ve gathered and provide a thorough analysis of that data to draw meaningful conclusions. The format and components of this section can vary widely, tailored to the specific nature of your research.
For example, if you are doing market research, you may include the market potential estimate, competitor analysis, and pricing analysis. These elements will help your organization determine the actual viability of a market opportunity.
Visual aids like charts, graphs, tables, and diagrams are potent tools to convey your key findings effectively. These materials may be numbered and sequenced (Figure 1, Figure 2, and so forth), accompanied by text to make sense of the insights.

5. Conclusions
The conclusion of a research presentation is where you pull together the ideas derived from your data presentation and analyses in light of the purpose of the research. For example, if the objective is to assess the market of a new product, the conclusion should determine the requirements of the market in question and tell whether there is a product-market fit.
Designing your conclusion slide should be straightforward and focused on conveying the key takeaways from your research. Keep the text concise and to the point. Present it in bullet points or numbered lists to make the content easily scannable.

6. Recommendations
The findings of your research might reveal elements that may not align with your initial vision or expectations. These deviations are addressed in the recommendations section of your presentation, which outlines the best course of action based on the result of the research.
What emerging markets should we target next? Do we need to rethink our pricing strategies? Which professionals should we hire for this special project? — these are some of the questions that may arise when coming up with this part of the research.
Recommendations may be combined with the conclusion, but presenting them separately to reinforce their urgency. In the end, the decision-makers in the organization or your clients will make the final call on whether to accept or decline the recommendations.

7. Questions Slide
Members of your audience are not involved in carrying out your research activity, which means there’s a lot they don’t know about its details. By offering an opportunity for questions, you can invite them to bridge that gap, seek clarification, and engage in a dialogue that enhances their understanding.
If your research is more business-oriented, facilitating a question and answer after your presentation becomes imperative as it’s your final appeal to encourage buy-in for your recommendations.
A simple “Ask us anything” slide can indicate that you are ready to accept questions.
1. Focus on the Most Important Findings
The truth about presenting research findings is that your audience doesn’t need to know everything. Instead, they should receive a distilled, clear, and meaningful overview that focuses on the most critical aspects.
You will likely have to squeeze in the oral presentation of your research into a 10 to 20-minute presentation, so you have to make the most out of the time given to you. In the presentation, don’t soak in the less important elements like historical backgrounds. Decision-makers might even ask you to skip these portions and focus on sharing the findings.
2. Do Not Read Word-per-word
Reading word-for-word from your presentation slides intensifies the danger of losing your audience’s interest. Its effect can be detrimental, especially if the purpose of your research presentation is to gain approval from the audience. So, how can you avoid this mistake?
- Make a conscious design decision to keep the text on your slides minimal. Your slides should serve as visual cues to guide your presentation.
- Structure your presentation as a narrative or story. Stories are more engaging and memorable than dry, factual information.
- Prepare speaker notes with the key points of your research. Glance at it when needed.
- Engage with the audience by maintaining eye contact and asking rhetorical questions.
3. Don’t Go Without Handouts
Handouts are paper copies of your presentation slides that you distribute to your audience. They typically contain the summary of your key points, but they may also provide supplementary information supporting data presented through tables and graphs.
The purpose of distributing presentation handouts is to easily retain the key points you presented as they become good references in the future. Distributing handouts in advance allows your audience to review the material and come prepared with questions or points for discussion during the presentation.
4. Actively Listen
An equally important skill that a presenter must possess aside from speaking is the ability to listen. We are not just talking about listening to what the audience is saying but also considering their reactions and nonverbal cues. If you sense disinterest or confusion, you can adapt your approach on the fly to re-engage them.
For example, if some members of your audience are exchanging glances, they may be skeptical of the research findings you are presenting. This is the best time to reassure them of the validity of your data and provide a concise overview of how it came to be. You may also encourage them to seek clarification.
5. Be Confident
Anxiety can strike before a presentation – it’s a common reaction whenever someone has to speak in front of others. If you can’t eliminate your stress, try to manage it.
People hate public speaking not because they simply hate it. Most of the time, it arises from one’s belief in themselves. You don’t have to take our word for it. Take Maslow’s theory that says a threat to one’s self-esteem is a source of distress among an individual.
Now, how can you master this feeling? You’ve spent a lot of time on your research, so there is no question about your topic knowledge. Perhaps you just need to rehearse your research presentation. If you know what you will say and how to say it, you will gain confidence in presenting your work.
All sources you use in creating your research presentation should be given proper credit. The APA Style is the most widely used citation style in formal research.
In-text citation
Add references within the text of your presentation slide by giving the author’s last name, year of publication, and page number (if applicable) in parentheses after direct quotations or paraphrased materials. As in:
The alarming rate at which global temperatures rise directly impacts biodiversity (Smith, 2020, p. 27).
If the author’s name and year of publication are mentioned in the text, add only the page number in parentheses after the quotations or paraphrased materials. As in:
According to Smith (2020), the alarming rate at which global temperatures rise directly impacts biodiversity (p. 27).
Image citation
All images from the web, including photos, graphs, and tables, used in your slides should be credited using the format below.
Creator’s Last Name, First Name. “Title of Image.” Website Name, Day Mo. Year, URL. Accessed Day Mo. Year.
Work cited page
A work cited page or reference list should follow after the last slide of your presentation. The list should be alphabetized by the author’s last name and initials followed by the year of publication, the title of the book or article, the place of publication, and the publisher. As in:
Smith, J. A. (2020). Climate Change and Biodiversity: A Comprehensive Study. New York, NY: ABC Publications.
When citing a document from a website, add the source URL after the title of the book or article instead of the place of publication and the publisher. As in:
Smith, J. A. (2020). Climate Change and Biodiversity: A Comprehensive Study. Retrieved from https://www.smith.com/climate-change-and-biodiversity.
1. Research Project Presentation PowerPoint Template

A slide deck containing 18 different slides intended to take off the weight of how to make a research presentation. With tons of visual aids, presenters can reference existing research on similar projects to this one – or link another research presentation example – provide an accurate data analysis, disclose the methodology used, and much more.
Use This Template
2. Research Presentation Scientific Method Diagram PowerPoint Template

Whenever you intend to raise questions, expose the methodology you used for your research, or even suggest a scientific method approach for future analysis, this circular wheel diagram is a perfect fit for any presentation study.
Customize all of its elements to suit the demands of your presentation in just minutes.
3. Thesis Research Presentation PowerPoint Template

If your research presentation project belongs to academia, then this is the slide deck to pair that presentation. With a formal aesthetic and minimalistic style, this research presentation template focuses only on exposing your information as clearly as possible.
Use its included bar charts and graphs to introduce data, change the background of each slide to suit the topic of your presentation, and customize each of its elements to meet the requirements of your project with ease.
4. Animated Research Cards PowerPoint Template

Visualize ideas and their connection points with the help of this research card template for PowerPoint. This slide deck, for example, can help speakers talk about alternative concepts to what they are currently managing and its possible outcomes, among different other usages this versatile PPT template has. Zoom Animation effects make a smooth transition between cards (or ideas).
5. Research Presentation Slide Deck for PowerPoint

With a distinctive professional style, this research presentation PPT template helps business professionals and academics alike to introduce the findings of their work to team members or investors.
By accessing this template, you get the following slides:
- Introduction
- Problem Statement
- Research Questions
- Conceptual Research Framework (Concepts, Theories, Actors, & Constructs)
- Study design and methods
- Population & Sampling
- Data Collection
- Data Analysis
Check it out today and craft a powerful research presentation out of it!
A successful research presentation in business is not just about presenting data; it’s about persuasion to take meaningful action. It’s the bridge that connects your research efforts to the strategic initiatives of your organization. To embark on this journey successfully, planning your presentation thoroughly is paramount, from designing your PowerPoint to the delivery.
Take a look and get inspiration from the sample research presentation slides above, put our tips to heart, and transform your research findings into a compelling call to action.

Like this article? Please share
Academics, Presentation Approaches, Research & Development Filed under Presentation Ideas
Related Articles

Filed under Design • March 27th, 2024
How to Make a Presentation Graph
Detailed step-by-step instructions to master the art of how to make a presentation graph in PowerPoint and Google Slides. Check it out!

Filed under Presentation Ideas • February 29th, 2024
How to Make a Fundraising Presentation (with Thermometer Templates & Slides)
Meet a new framework to design fundraising presentations by harnessing the power of fundraising thermometer templates. Detailed guide with examples.

Filed under Presentation Ideas • February 15th, 2024
How to Create a 5 Minutes Presentation
Master the art of short-format speeches like the 5 minutes presentation with this article. Insights on content structure, audience engagement and more.
Leave a Reply

- Event Website Publish a modern and mobile friendly event website.
- Registration & Payments Collect registrations & online payments for your event.
- Abstract Management Collect and manage all your abstract submissions.
- Peer Reviews Easily distribute and manage your peer reviews.
- Conference Program Effortlessly build & publish your event program.
- Virtual Poster Sessions Host engaging virtual poster sessions.
- Customer Success Stories
- Wall of Love ❤️
How to Present Your Research (Guidelines and Tips)

Published on 01 Feb 2023

Presenting at a conference can be stressful, but can lead to many opportunities, which is why coming prepared is super beneficial.
The internet is full to the brim with tips for making a good presentation. From what you wear to how you stand to good slide design, there’s no shortage of advice to make any old presentation come to life.
But, not all presentations are created equal. Research presentations, in particular, are unique.
Communicating complex concepts to an audience with a varied range of awareness about your research topic can be tricky. A lack of guidance and preparation can ruin your chance to share important information with a conference community. This could mean lost opportunities in collaboration or funding or lost confidence in yourself and your work.
So, we’ve put together a list of tips with research presentations in mind. Here’s our top to-do’s when preparing to present your research.
Take every research presentation opportunity
The worst thing you could do for your research is to not present it at all. As intimidating as it can be to get up in front of an audience, you shouldn’t let that stop you from seizing a good opportunity to share your work with a wider community.
These contestants from the Vitae Three Minute Thesis Competition have some great advice to share on taking every possible chance to talk about your research.
Double-check your research presentation guidelines
Before you get started on your presentation, double-check if you’ve been given guidelines for it.
If you don’t have specific guidelines for the context of your presentation, we’ve put together a general outline to help you get started. It’s made with the assumption of a 10-15 minute presentation time. So, if you have longer to present, you can always extend important sections or talk longer on certain slides:
- Title Slide (1 slide) - This is a placeholder to give some visual interest and display the topic until your presentation begins.
- Short Introduction (2-3 slides) - This is where you pique the interest of your audience and establish the key questions your presentation covers. Give context to your study with a brief review of the literature (focus on key points, not a full review). If your study relates to any particularly relevant issues, mention it here to increase the audience's interest in the topic.
- Hypothesis (1 slide) - Clearly state your hypothesis.
- Description of Methods (2-3 slides) - Clearly, but briefly, summarize your study design including a clear description of the study population, the sample size and any instruments or manipulations to gather the data.
- Results and Data Interpretation (2-4 slides) - Illustrate your results through simple tables, graphs, and images. Remind the audience of your hypothesis and discuss your interpretation of the data/results.
- Conclusion (2-3 slides) - Further interpret your results. If you had any sources of error or difficulties with your methods, discuss them here and address how they could be (or were) improved. Discuss your findings as part of the bigger picture and connect them to potential further outcomes or areas of study.
- Closing (1 slide) - If anyone supported your research with guidance, awards, or funding, be sure to recognize their contribution. If your presentation includes a Q&A session, open the floor to questions.
Plan for about one minute for each slide of information that you have. Be sure that you don’t cram your slides with text (stick to bullet points and images to emphasize key points).
And, if you’re looking for more inspiration to help you in scripting an oral research presentation. University of Virginia has a helpful oral presentation outline script .

A PhD Student working on an upcoming oral presentation.
Put yourself in your listeners shoes
As mentioned in the intro, research presentations are unique because they deal with specialized topics and complicated concepts. There’s a good chance that a large section of your audience won’t have the same understanding of your topic area as you do. So, do your best to understand where your listeners are at and adapt your language/definitions to that.
There’s an increasing awareness around the importance of scientific communication. Comms experts have even started giving TED Talks on how to bridge the gap between science and the public (check out Talk Nerdy to Me ). A general communication tip is to find out what sort of audience will listen to your talk. Then, beware of using jargon and acronyms unless you're 100% certain that your audience knows what they mean.
On the other end of the spectrum, you don’t want to underestimate your audience. Giving too much background or spending ages summarizing old work to a group of experts in the field would be a waste of valuable presentation time (and would put you at risk of losing your audience's interest).
Finally, if you can, practice your presentation on someone with a similar level of topic knowledge to the audience you’ll be presenting to.
Use scientific storytelling in your presentation
In scenarios where it’s appropriate, crafting a story allows you to break free from the often rigid tone of scientific communications. It helps your brain hit the refresh button and observe your findings from a new perspective. Plus, it can be a lot of fun to do!
If you have a chance to use scientific storytelling in your presentation, take full advantage of it. The best way to weave a story for your audience into a presentation is by setting the scene during your introduction. As you set the context of your research, set the context of your story/example at the same time. Continue drawing those parallels as you present. Then, deliver the main message of the story (or the “Aha!”) moment during your presentation’s conclusion.
If delivered well, a good story will keep your audience on the edge of their seats and glued to your entire presentation.
Emphasize the “Why” (not the “How”) of your research
Along the same lines as using storytelling, it’s important to think of WHY your audience should care about your work. Find ways to connect your research to valuable outcomes in society. Take your individual points on each slide and bring things back to the bigger picture. Constantly remind your listeners how it’s all connected and why that’s important.
One helpful way to get in this mindset is to look back to the moment before you became an expert on your topic. What got you interested? What was the reason for asking your research question? And, what motivated you to power through all the hard work to come? Then, looking forward, think about what key takeaways were most interesting or surprised you the most. How can these be applied to impact positive change in your research field or the wider community?
Be picky about what you include
It’s tempting to discuss all the small details of your methods or findings. Instead, focus on the most important information and takeaways that you think your audience will connect with. Decide on these takeaways before you script your presentation so that you can set the scene properly and provide only the information that has an added value.
When it comes to choosing data to display in your presentation slides, keep it simple. Wherever possible, use visuals to communicate your findings as opposed to large tables filled with numbers. This article by Richard Chambers has some great tips on using visuals in your slides and graphs.
Hide your complex tables and data in additional slides
With the above tip in mind: Just because you don’t include data and tables in your main presentation slides, doesn’t mean you can’t keep them handy for reference. If there’s a Q&A session after your presentation (or if you’ll be sharing your slides to view on-demand after) one great trick is to include additional slides/materials after your closing slide. You can keep these in your metaphorical “back pocket” to refer to if a specific question is asked about a data set or method. They’re also handy for people viewing your presentation slides later that might want to do a deeper dive into your methods/results.
However, just because you have these extra slides doesn’t mean you shouldn’t make the effort to make that information more accessible. A research conference platform like Fourwaves allows presenters to attach supplementary materials (figures, posters, slides, videos and more) that conference participants can access anytime.
Leave your audience with (a few) questions
Curiosity is a good thing. Whether you have a Q&A session or not, you should want to leave your audience with a few key questions. The most important one:
“Where can I find out more?”
Obviously, it’s important to answer basic questions about your research context, hypothesis, methods, results, and interpretation. If you answer these while focusing on the “Why?” and weaving a good story, you’ll be setting the stage for an engaging Q&A session and/or some great discussions in the halls after your presentation. Just be sure that you have further links or materials ready to provide to those who are curious.
Conclusion: The true expert in your research presentation
Throughout the entire process of scripting, creating your slides, and presenting, it’s important to remember that no one knows your research better than you do. If you’re nervous, remind yourself that the people who come to listen to your presentation are most likely there due to a genuine interest in your work. The pressure isn’t to connect with an uninterested audience - it’s to make your research more accessible and relevant for an already curious audience.
Finally, to practice what we preached in our last tip: If you’re looking to learn more about preparing for a research presentation, check out our articles on how to dress for a scientific conference and general conference presentation tips .
5 Best Event Registration Platforms for Your Next Conference
By having one software to organize registrations and submissions, a pediatric health center runs aro...
5 Essential Conference Apps for Your Event
In today’s digital age, the success of any conference hinges not just on the content and speakers bu...
No internet connection.
All search filters on the page have been cleared., your search has been saved..
- All content
- Dictionaries
- Encyclopedias
- Expert Insights
- Foundations
- How-to Guides
- Journal Articles
- Little Blue Books
- Little Green Books
- Project Planner
- Tools Directory
- Sign in to my profile My Profile
- Sign in Signed in
- My profile My Profile
- Offline Playback link

Have you created a personal profile? sign in or create a profile so that you can create alerts, save clips, playlists and searches.
Presenting at an Academic Conference: Example Presentation
- Watching now: Chapter 1: Presenting at an Academic Conference: Example Presentation Start time: 00:00:00 End time: 00:06:53
Video Type: Tutorial
Mount, K. (Academic). (2018). Presenting at an academic conference: example presentation [Video]. Sage Research Methods. https:// doi. org/10.4135/9781526434456
Mount, Katherine. "Presenting at an Academic Conference: Example Presentation." In Sage Video . London: SAGE Publications Ltd, 2018. Video, 00:06:53. https:// doi. org/10.4135/9781526434456.
Mount, K., 2018. Presenting at an Academic Conference: Example Presentation , Sage Video. [Streaming Video] London: Sage Publications Ltd. Available at: <https:// doi. org/10.4135/9781526434456 & gt; [Accessed 1 Apr 2024].
Mount, Katherine. Presenting at an Academic Conference: Example Presentation . Online video clip. SAGE Video. London: SAGE Publications, Ltd., 5 Mar 2018. doi: https:// doi. org/10.4135/9781526434456. 1 Apr 2024.
Presenting at an Academic Conference: Example Presentation [Streaming video]. 2018. doi:10.4135/9781526434456. Accessed 04/01/2024
Please log in from an authenticated institution or log into your member profile to access the email feature.
- Sign in/register
Add this content to your learning management system or webpage by copying the code below into the HTML editor on the page. Look for the words HTML or </>. Learn More about Embedding Video icon link (opens in new window)
Sample View:

- Download PDF opens in new window
- icon/tools/download-video icon/tools/video-downloaded Download video Downloading... Video downloaded
Katherine Mount discusses preparation for an academic symposium.
Chapter 1: Presenting at an Academic Conference: Example Presentation
- Start time: 00:00:00
- End time: 00:06:53
- Product: Sage Research Methods Video: Practical Research and Academic Skills
- Type of Content: Tutorial
- Title: Presenting at an Academic Conference: Example Presentation
- Publisher: SAGE Publications Ltd
- Series: Presentation Skills
- Publication year: 2018
- Online pub date: March 05, 2018
- Discipline: Sociology
- Methods: Communicating and disseminating research , Professional communication
- Duration: 00:06:53
- DOI: https:// doi. org/10.4135/9781526434456
- Keywords: articulation (speech) , audiences , body language , communication skills , conferences , gestures , goal setting , nonverbal cues and communication , peer review , presentation skills , Skills coaching Show all Show less
Academic: Katherine Mount
Sign in to access this content
Get a 30 day free trial, more like this, sage recommends.
We found other relevant content for you on other Sage platforms.
Have you created a personal profile? Login or create a profile so that you can save clips, playlists and searches
Navigating away from this page will delete your results
Please save your results to "My Self-Assessments" in your profile before navigating away from this page.
Sign in to my profile
Sign up for a free trial and experience all Sage Learning Resources have to offer.
You must have a valid academic email address to sign up.
Get off-campus access
- View or download all content my institution has access to.
Sign up for a free trial and experience all Sage Research Methods has to offer.
- view my profile
- view my lists

The Research Conference Presentation
Apr 17, 2013
160 likes | 375 Views
The Research Conference Presentation. William Perez, Ph.D. MMP Workshop 2-8-08. Outline. Presentation Formats Preparation Presenting Q&A. Presentation Formats. Poster Session Paper Presentation/Symposium Roundtable. Before the poster presentation.
Share Presentation
- important difference
- eye contact
- key articles research literature
- mmp workshop
- load powerpoint slides

Presentation Transcript
The Research Conference Presentation William Perez, Ph.D. MMP Workshop 2-8-08
Outline • Presentation Formats • Preparation • Presenting • Q&A
Presentation Formats • Poster Session • Paper Presentation/Symposium • Roundtable
Before the poster presentation • Turn your proposal/paper into a poster presentation format • Review key articles/research literature to reference during your discussion with visitors • Rehearse a 1-2 minute synopsis of the main findings and its implications • Review all the details of the study • Review poster format guidelines usually posted on conference website or program/schedule • Print 30-40 handouts • Bring a pad of paper and pen to get people’s email in case you run out of handouts • You can also do this in lieu of handouts
Poster Content • Title • Introduction • Key Literature Reference • Research Question • Methods • Sample • Procedures • Results • Discussion/Conclusion • References • Contact Information
Effective Poster Presentations • Poster Content needs to be succinct • No long titles • Pay careful attention to the title-shorter is better • No long paragraphs • Brief sentences • Bullet points • Highlight only key findings • Do not try to include all findings • Include one key figure and/or one key table • Figures and tables should be easy to read/understand • If using PowerPoint, use no more than 10 slides
During the poster presentation • Have plenty of handouts ready with contact information and/or business cards • Be ready to discuss limitations of the study • If you can’t address a particular question it’s ok to say “I don’t know,” or “I will need to consider that further, thank you for raising the issue.” • Use the opportunity to network/promote your work • Be able to articulate in 2-3 minutes the importance/main findings/implications of the study
Paper Presentation/Symposium • Usually 5 or 6 people • Coordinate presentation with others • An important difference between a poster presentation and a paper presentation is that you have more space/time to articulate rationale, important findings and implications
Paper Organization • Title • Introduction • Key Literature References • Research Questions • Methods • Sample • Procedures • Measures • Results • Discussion/Conclusion • References • Contact Information
Before the presentation • Figure out your time limit and organize your presentation accordingly • Coordinate the presentation order with fellow presenters • Practice your presentation several times to make sure you stay within the time limit • Practice in front of the mirror • Record your presentation and play it back • Make modifications based on your practice sessions • Prepare 30-40 handouts • As backup, prepare full-size printed slides and/or overhead projector slides
During the presentation • Load PowerPoint Slides into one computer, and open them all before symposium starts to use your time more effectively • Delivery basics • Speak in a slow and deliberate pace, don’t rush • Make eye contact with the audience
During the Presentation • Fielding Questions/Comments • If you do not know the answer • Belligerent audience member • Dealing with discipline specific language and vocabulary at a transdisciplinary conference
Q&A • Questions from the audience
- More by User

The Conference Presentation
The Conference Presentation Lynda Gagne University of Victoria October 2004 Overview Preparing for your presentation Giving your presentation Chairing a session Discussing a paper Concluding comments Preparing for your presentation Knowing your audience Knowing yourself
842 views • 24 slides

Conference Presentation Skills
? 2006 Michael zur Muehlen. All Rights Reserved.. 6/27/2012. 2. What this talk is about. How to give a good research talkWhy to presentWhat to present (and what to leave out)How to present. Your paper is the productYour talk is the advertisement. ? 2006 Michael zur Muehlen. All Rights Reserve
571 views • 40 slides

Presentation to the Second HESA Biennial Research and Innovation Conference
Presentation to the Second HESA Biennial Research and Innovation Conference. Emerging Policy Initiatives - DST. Imraan Patel Deputy Director-General: Socio-Economic Partnerships. Evolution of the Research, Development, and Innovation Policy Package Policy Priorities
388 views • 22 slides

CII Annual Conference 2005: Research Presentation
CII Annual Conference 2005: Research Presentation. Commodity vs Value-Added Services: Lost in Translation. presented by. Commodity vs Value-Added Contractor Services Research Team. Commodity vs Value-Added Contractor Services Research Team (RT 205). Jose A. Buitrago CSA Group
194 views • 5 slides

Presentation to the Voluntary Sector and Volunteering Research Conference
Mapping supply of and demand for volunteers in Scotland: what next for volunteering policy, practice and research?. Presentation to the Voluntary Sector and Volunteering Research Conference . Helen Harper & Kathleen Doyle. 11 September 2013. Policy Context. Localism
322 views • 18 slides

the dry presentation of the conference
the dry presentation of the conference. “Form R and Tier II”. by Susan Murphy. The Basics of Tier II. Hazardous Chemical Reporting, Community Right-to-Know. 40CFR370. " Tier II ” is the reporting form nickname
273 views • 14 slides

Conference presentation
Crawdad . Conference presentation. Southeast Kentucky Community and Technical College.
288 views • 19 slides

Conference Presentation
Conference Presentation. City University of New York (CUNY)- Lehman College ePortfolio on Reflective Practice for Science Education Graduate Students. Conference Presentation . City University of New York Lehman College E-Portfolio Program Rationale E-Portfolio Elements
257 views • 12 slides

Presentation at the International Conference
Necessitiy and Importance of the Optional Protocol to the Convention on the Rights of People with Disabilities. Presentation at the International Conference Guardianship – Legal Capacity – Supported Decision Making Budapest, 18th & 19th October, 2007 Ulrich Hellmann, Lebenshilfe, Germany.
322 views • 22 slides

PRESENTATION TO THE PENSION CONFERENCE
PRESENTATION TO THE PENSION CONFERENCE. VICTOR J. SENYE BOTSWANA INSURANCE FUND MANAGEMENT. WHAT IS THE OBJECTIVE. Highlight the pressure of pension investing Challenges posed by local markets Searching for growth and performance Why property investment Experience of Botswana.
230 views • 10 slides

Presentation at the international conference
. Presentation at the international conference Knowledge Society and Implementation of the Lisbon Strategy in Europe and Latvia Riga, 14 - 15 October 2004 organized by the Banking Institution of Higher Education
837 views • 35 slides

The Desk Research Presentation
The Desk Research Presentation. Mariam Darchiashvili Chavchavadze State University, Georgia. Content. Introducing the university Discussing problems in election surveys Assuming Georgian voters’ profile along with statistical data. Some facts and figures about the university:
892 views • 33 slides

A Presentation to the TvB Research Conference
A Presentation to the TvB Research Conference. Electronic Data Interface (EDI) . Electronic Negotiation Avail Requests & WebAvails Electronic Contracting Client Information (& spot avails) Makegoods & other Revisions Electronic Invoicing Including post-buy analysis.
195 views • 10 slides

NSI Presentation to The TVB Research Conference
NSI Presentation to The TVB Research Conference. October 25th, 2000. Agenda. The Quality Initiative at NSI: Catherine Herkovic- SVP Sales and Marketing NSI Initiatives Update: Christine Bourquin- Director, Statistical Research Meter Diary ProFile DMA: Catherine Herkovic
177 views • 5 slides

Conference Presentation. By Royce W ibbenmeyer. Math.
519 views • 35 slides

The Research Poster Presentation
The Research Poster Presentation. NASA Summer Interns, 2014 Presented by: Dr. Charlotte Zeamer Student Coordinator Education Office NASA Ames Research Center. A good poster will…. Meet the conventions for the specific event Match the audience knowledge base and interests
311 views • 13 slides

Presentation at the ASEA Conference
Presentation at the ASEA Conference. Johannesburg - 19 September 2006. Custody Service: An Indispensable Link In a Financial Market. Augustine Kwakye-Agyekum. Regional Deputy Head – Barclays Securities Administration (BSA). Agenda. Structure of a capital market
287 views • 16 slides

Presentation to the INSETA CONFERENCE
Presentation to the INSETA CONFERENCE. 25 February 2004. Presentation. Standards of Effective Practice Tension: Quantity vs. Level of Skills Exit Strategies and Job development A message from the Youth of South Africa. Standards of Effective Practice.
197 views • 8 slides

259 views • 13 slides

Conference presentation of research
Conference presentation of research. News Hilights of AERA Lolights of AERA How many speakers faced the audience during their presentation? Bad PPT designs. First complete Ed.D. thesis draft!. The "visited link" color bug. http://tep.ucsd.edu http://www.ucsd.edu. Slides design.
171 views • 9 slides

Conference Presentation. 4 th. Lisbon, 25 th and 26th May, 2004. It’s time to do business !. 4 th Venture Capital IT. Why you should come. The questions we want to answer. What’s the role of Venture Capital in building a more dynamic and entrepreneurial Portugal?
116 views • 11 slides

104 views • 10 slides
IMAGES
VIDEO
COMMENTS
Research indicates images are much better retained than words, a phenomenon known as the Picture Superiority Effect; ... It is a part of the conference presentation itself, so you should pace your speech to give enough time for the audience to ask 1-3 questions and get a proper answer.
Research conference presentation slides do not have to be self-explanatory. In this post, you will learn three crucial tips for preparing scientific conference presentation slides to efficiently explain your research. Tip No.1: One thought per slide. Tip No.2: Presentation slides are for visual information. Tip No.3: Use action titles.
Tips for research paper presentation in national conferences and international conferences with sample ppt examples. For Business Enquiries: https://bit.ly/3...
A research paper presentation is often used at conferences and in other settings where you have an opportunity to share your research, and get feedback from your colleagues. Although it may seem as simple as summarizing your research and sharing your knowledge, successful research paper PowerPoint presentation examples show us that there's a ...
Salman Khan's GEL Conference Presentation; Salman Khan is the founder of the Khan Academy, a non-profit organization whose mission is to "provide free, world-class education to anyone, anywhere." His presentation is a testament to the kind of teacher Salman Khan is. ... Use our free (and colorful) research stage slide template to make ...
Science & Research Presentation PowerPoint Template. This PowerPoint template is a perfect choice for preparing a research presentation to share your scientific findings and reports. The template has 30 unique slides with unlimited color options. There are a few infographics included in the slideshow as well.
Theory vs. methods vs. data. In order of importance, write down all the points you want your viewer to understand. Focus your presentation on the first three points. Include sections similar to a typical journal article. SUMMARIZE! Aim for approximately 1 minute per slide. Usually 10-15 slides total.
A good scientific presentation achieves three things: you communicate the science clearly, your research leaves a lasting impression on your audience, and you enhance your reputation as a scientist. ... a 15-minute conference presentation) or tell the story of multiple studies (e.g., a PhD defense or 50-minute conference keynote talk). For a ...
In the case of a research presentation, you want a formal and academic-sounding one. It should include: The full title of the report. The date of the report. The name of the researchers or department in charge of the report. The name of the organization for which the presentation is intended.
Outline of Conference Presentation Results (3-4 slides). Present key results of study or data analysis. Don't superficially cover all results; cover key results well. Summary (1 slide). Future work (0-1 slides). Optionally give problems this research opens up. Total of 10-15 slides depending on time.
Discuss your findings as part of the bigger picture and connect them to potential further outcomes or areas of study. Closing (1 slide) - If anyone supported your research with guidance, awards, or funding, be sure to recognize their contribution. If your presentation includes a Q&A session, open the floor to questions.
Product: Sage Research Methods Video: Practical Research and Academic Skills; Type of Content: Tutorial Title: Presenting at an Academic Conference: Example Presentation Publisher: SAGE Publications Ltd Series: Presentation Skills; Publication year: 2018; Online pub date: March 05, 2018
The key to an effective conference presentation lies in being well-prepared. Here are a few tips that will make the process smoother for you: 1. Write your paper with the audience in mind: A conference paper should be different from a journal article. Remember that your paper is meant to be heard, not read.
References: American College of Physicians. Writing a Research Abstract.Accessed on April 18, 2018. David A. Cook & Georges Bordage (2016) Twelve tips on writing abstracts and titles: How to get people to use and cite your work, Medical Teacher, 38:11, 1100-1104, DOI: 10.1080/0142159X.2016.1181732.. Andrade C. How to write a good abstract for a scientific paper or conference presentation.
And once you're ready, grab an editable research presentation template from Canva. Finding the right PPT template for your research presentation is a breeze with Canva. Our design gallery has hundreds of unique templates you can use, whether you're presenting to prospective clients at work, to colleagues at a conference, or to instructors ...
These research presentation templates are suitable for academic presentations, scientific conferences, and research symposiums. They can be used by researchers, scientists, scholars, and students to showcase their findings, methodologies, and data analysis in a visually appealing and professional manner.
a Conference Presentation Undergraduate Research Hub. What is an Abstract? •"The abstract is a brief, clear summary of the information in your presentation. A well-prepared abstract enables readers to identify the basic content quickly and accurately, to determine its ... research, we are gathering information that can highlight how Latino
Download the Hyponatremia Diagnosis and Detection Breakthrough presentation for PowerPoint or Google Slides. Treating diseases involves a lot of prior research and clinical trials. But whenever there's a new discovery, a revolutionary finding that opens the door to new treatments, vaccines or ways to prevent illnesses, it's great news ...
Download the Minimalist Conference Style Presentation presentation for PowerPoint or Google Slides and start impressing your audience with a creative and original design. Slidesgo templates like this one here offer the possibility to convey a concept, idea or topic in a clear, concise and visual way, by using different graphic... Multi-purpose.
Simply edit the conference presentation template with a few clicks on Canva. Whether you're a design newbie or passionate about fun transitions, you'll find a sample that's perfect for you. From research proposals to corporate presentations, academic lectures to project updates, class reports to sales pitches, we've got them all.
The Research Conference Presentation William Perez, Ph.D. MMP Workshop 2-8-08. Outline • Presentation Formats • Preparation • Presenting • Q&A. Presentation Formats • Poster Session • Paper Presentation/Symposium • Roundtable. Before the poster presentation • Turn your proposal/paper into a poster presentation format • Review key articles/research literature to reference ...
University of North Dakota
GTC— Powering a new era of computing, NVIDIA today announced that the NVIDIA Blackwell platform has arrived — enabling organizations everywhere to build and run real-time generative AI on trillion-parameter large language models at up to 25x less cost and energy consumption than its predecessor. The Blackwell GPU architecture features six ...