| GEOG 30N Environment and Society in a Changing World |

- ASSIGNMENTS
- Program Home Page
- LIBRARY RESOURCES

Case Study: The Amazon Rainforest
The Amazon in context
Tropical rainforests are often considered to be the “cradles of biodiversity.” Though they cover only about 6% of the Earth’s land surface, they are home to over 50% of global biodiversity. Rainforests also take in massive amounts of carbon dioxide and release oxygen through photosynthesis, which has also given them the nickname “lungs of the planet.” They also store very large amounts of carbon, and so cutting and burning their biomass contributes to global climate change. Many modern medicines are derived from rainforest plants, and several very important food crops originated in the rainforest, including bananas, mangos, chocolate, coffee, and sugar cane.

In order to qualify as a tropical rainforest, an area must receive over 250 centimeters of rainfall each year and have an average temperature above 24 degrees centigrade, as well as never experience frosts. The Amazon rainforest in South America is the largest in the world. The second largest is the Congo in central Africa, and other important rainforests can be found in Central America, the Caribbean, and Southeast Asia. Brazil contains about 40% of the world’s remaining tropical rainforest. Its rainforest covers an area of land about 2/3 the size of the continental United States.
There are countless reasons, both anthropocentric and ecocentric, to value rainforests. But they are one of the most threatened types of ecosystems in the world today. It’s somewhat difficult to estimate how quickly rainforests are being cut down, but estimates range from between 50,000 and 170,000 square kilometers per year. Even the most conservative estimates project that if we keep cutting down rainforests as we are today, within about 100 years there will be none left.
How does a rainforest work?
Rainforests are incredibly complex ecosystems, but understanding a few basics about their ecology will help us understand why clear-cutting and fragmentation are such destructive activities for rainforest biodiversity.

High biodiversity in tropical rainforests means that the interrelationships between organisms are very complex. A single tree may house more than 40 different ant species, each of which has a different ecological function and may alter the habitat in distinct and important ways. Ecologists debate about whether systems that have high biodiversity are stable and resilient, like a spider web composed of many strong individual strands, or fragile, like a house of cards. Both metaphors are likely appropriate in some cases. One thing we can be certain of is that it is very difficult in a rainforest system, as in most other ecosystems, to affect just one type of organism. Also, clear cutting one small area may damage hundreds or thousands of established species interactions that reach beyond the cleared area.
Pollination is a challenge for rainforest trees because there are so many different species, unlike forests in the temperate regions that are often dominated by less than a dozen tree species. One solution is for individual trees to grow close together, making pollination simpler, but this can make that species vulnerable to extinction if the one area where it lives is clear cut. Another strategy is to develop a mutualistic relationship with a long-distance pollinator, like a specific bee or hummingbird species. These pollinators develop mental maps of where each tree of a particular species is located and then travel between them on a sort of “trap-line” that allows trees to pollinate each other. One problem is that if a forest is fragmented then these trap-line connections can be disrupted, and so trees can fail to be pollinated and reproduce even if they haven’t been cut.
The quality of rainforest soils is perhaps the most surprising aspect of their ecology. We might expect a lush rainforest to grow from incredibly rich, fertile soils, but actually, the opposite is true. While some rainforest soils that are derived from volcanic ash or from river deposits can be quite fertile, generally rainforest soils are very poor in nutrients and organic matter. Rainforests hold most of their nutrients in their live vegetation, not in the soil. Their soils do not maintain nutrients very well either, which means that existing nutrients quickly “leech” out, being carried away by water as it percolates through the soil. Also, soils in rainforests tend to be acidic, which means that it’s difficult for plants to access even the few existing nutrients. The section on slash and burn agriculture in the previous module describes some of the challenges that farmers face when they attempt to grow crops on tropical rainforest soils, but perhaps the most important lesson is that once a rainforest is cut down and cleared away, very little fertility is left to help a forest regrow.
What is driving deforestation in the Amazon?
Many factors contribute to tropical deforestation, but consider this typical set of circumstances and processes that result in rapid and unsustainable rates of deforestation. This story fits well with the historical experience of Brazil and other countries with territory in the Amazon Basin.
Population growth and poverty encourage poor farmers to clear new areas of rainforest, and their efforts are further exacerbated by government policies that permit landless peasants to establish legal title to land that they have cleared.
At the same time, international lending institutions like the World Bank provide money to the national government for large-scale projects like mining, construction of dams, new roads, and other infrastructure that directly reduces the forest or makes it easier for farmers to access new areas to clear.
The activities most often encouraging new road development are timber harvesting and mining. Loggers cut out the best timber for domestic use or export, and in the process knock over many other less valuable trees. Those trees are eventually cleared and used for wood pulp, or burned, and the area is converted into cattle pastures. After a few years, the vegetation is sufficiently degraded to make it not profitable to raise cattle, and the land is sold to poor farmers seeking out a subsistence living.
Regardless of how poor farmers get their land, they often are only able to gain a few years of decent crop yields before the poor quality of the soil overwhelms their efforts, and then they are forced to move on to another plot of land. Small-scale farmers also hunt for meat in the remaining fragmented forest areas, which reduces the biodiversity in those areas as well.
Another important factor not mentioned in the scenario above is the clearing of rainforest for industrial agriculture plantations of bananas, pineapples, and sugar cane. These crops are primarily grown for export, and so an additional driver to consider is consumer demand for these crops in countries like the United States.
These cycles of land use, which are driven by poverty and population growth as well as government policies, have led to the rapid loss of tropical rainforests. What is lost in many cases is not simply biodiversity, but also valuable renewable resources that could sustain many generations of humans to come. Efforts to protect rainforests and other areas of high biodiversity is the topic of the next section.
Stay informed: Sign up for eNews
- Facebook (opens in new window)
- X (opens in new window)
- Instagram (opens in new window)
- YouTube (opens in new window)
- LinkedIn (opens in new window)
UC Press Blog
Case studies in environmental geography: a cse special collection.
Introduction to the Special Collection
Geography and environmental case studies are regularly one and the same. Unpacking environmental case studies requires a geographic framework, examining how flows—economic, environmental, cultural, political—intersect in an absolute location and define the uniqueness of place. Geography and case studies are inherently interdisciplinary. Most case studies are inherently geographic (and everything happens somewhere).
The case studies in this collection, drawn from articles published in Case Studies in the Environment between 2022 and 2023, demonstrate the diverse ways that geographic theories and methods can assist in the analysis of environmental cases, and equip readers with better problem-solving skills. These manuscripts demonstrate the way in which space and place are active actors in creating environmental problems, and perhaps provide a map for navigating potential solutions.

Upholding geography’s cartographic tradition, Müller and colleagues chronicle the use of participatory mapping with respect to wind turbine planning in Switzerland. A winner of the 2022 Prize Competition Honorable Mention, Participatory Mapping and Counter-Representations in Wind Energy Planning: A Radical Democracy Perspective shows how the cartographic process could demonstrate multiple discourses and intersections of protest. In addition, it includes a number of beautiful maps which show a sophisticated understanding of cartographic principles.
In Barriers and Facilitators for Successful Community Forestry: Lessons Learned and Practical Applications From Case Studies in India and Guatemala , Jamkar et. al propose an analytical framework for evaluating community-based forest management projects using community capital, markets, and land tenure. They demonstrate the robustness of this framework at study sites in India and Guatemala.
In The Bronx River and Environmental Justice Through the Lens of a Watershed , Finewood et al. look at environmental justice using a multi-scalar place-based approach. Using the Bronx watershed as a case study, the authors demonstrate how environmental harm caused upstream aggregates in the downstream flow to less-enfranchised communities, causing disproportionate harm.
In a lyrical and unique contribution, Cherry River: Art, Music, and Indigenous Stakeholders of Water Advocacy in Montana , Davidson narrates the story of a music performance designed to bring awareness of drought conditions in Montana. On a deeper level, the performance fostered community engagement, particularly between indigenous and non-indigenous communities. The manuscript casts the arts as a space of collaboration and advocacy.
Turia et. al, in Monitoring the Multiple Functions of Tropical Rainforest on a National Scale: An Overview From Papua New Guinea (part of the special collection, Papua New Guinea’s Forests ) evaluate the effectiveness of national forest inventories in Papua New Guinea, ultimately using rigorous sampling methods to recommend an expanded approach.
The urgency of today’s environmental problems demands interdisciplinary approaches and broad ways of linking together seeming disparate pieces. It involves looking at individuals not in isolation but as parts of networks, and at multiple scales. Geography exemplifies these approaches. We are proud to feature articles from the field of geography, physical and human, wrestling with environmental cases for the good of humanity and nature.
Featured Articles Müller, S., Flacke, J., & Buchecker, M. (2022). Participatory mapping and counter-representations in wind energy planning: A Radical Democracy Perspective. Case Studies in the Environment , 6 (1), 1561651.
Jamkar, V., Butler, M., & Current, D. (2023). Barriers and facilitators for successful community forestry: Lessons learned and practical applications from case studies in India and Guatemala. Case Studies in the Environment , 7 (1), 1827932.
Finewood, M. H., Holloman, D. E., Luebke, M. A., & Leach, S. (2023). The Bronx River and Environmental Justice Through the Lens of a Watershed. Case Studies in the Environment , 7 (1), 1824941.
Davidson, J. C. (2022). Cherry River: Art, Music, and Indigenous Stakeholders of Water Advocacy in Montana. Case Studies in the Environment , 6 (1), 1813541. Turia, R., Gamoga, G., Abe, H., Novotny, V., Attorre, F., & Vesa, L. (2022). Monitoring the Multiple Functions of Tropical Rainforest on a National Scale: An Overview From Papua New Guinea. Case Studies in the Environment , 6 (1), 1547792.
- Tumblr (opens in new window)
- Email (opens in new window)
- Case Studies in the Environment ,
- Environmental Studies ,
- Geography ,
- Meetings and Exhibits ,
- American Association of Geographers ,
About the Author

Marine Critical Issues: Case Studies
Students use case studies to examine human impacts on marine ecosystems. They evaluate case studies in terms of an area's history, geography, habitats, species, stakeholders, human uses and impacts, and management goals.
Oceanography, Earth Science, Biology, Ecology, Geography, Human Geography, Physical Geography
Loading ...

This resource is also available in Spanish .
Humans are having a negative impact on marine ecosystems due to pollution, overfishing, habitat destruction, and other unsustainable practices. Analyzing case studies of human impacts on marine ecosystems helps students to understand the critical issues facing the world's oceans today, as well as the positive effects that the establishment of marine protected areas can have on the health of the ocean.
Informal Assessment
Assess students based on their responses to the discussion questions and the completeness and accuracy of their worksheets.
Extending the Learning
Using their worksheet Marine Ecosystem Critical Issues: Case Studies as a guide, have students research, create, and present a case study for a local aquatic or terrestrial protected area.
Prior Knowledge
- Marine ecosystems, interrelationships, and human impacts

1. Activate students’ prior knowledge and build background.
Remind students that Marine Protected Areas (MPAs) are areas of the marine environment that are protected by laws in order to preserve their natural and cultural resources. In order to establish and manage MPAs, case studies are created. Ask: What are case studies? Elicit from students that case studies outline important information about an area’s history, geography, habitats, species, human uses, and management goals. Case studies also describe threats to the area and explain why the area should be protected. The goals of such protection focus on restoring ecological balance to the area. Case studies help stakeholders understand how humans impact the area and what can be done to restore ecological balance and sustainably manage the area’s cultural and natural resources. Ask: Who are stakeholders? Remind students that stakeholders are people, organizations, or political entities interested in and/or affected by the outcome of management decisions.
2. Use Apo Island as an example case study of human impacts on a marine ecosystem.
Distribute the Marine Ecosystem Critical Issues: Case Studies worksheet and read aloud the directions. Review the categories of information in the chart, making sure that students know what components of the case study they need to record. Explain that for Case Study #1: Apo Island, they will view a video and work together as a class to complete the chart. For Case Study #2: Galápagos Marine Reserve, they will review a written case study and work in small groups to complete the chart. Show students the video, “EcoTipping Point Success Stories: Apo Island” (6 minutes, 30 seconds) and have them take notes on their worksheets as they watch. After the video, discuss the information students recorded. Ask:
- What happened as a result of Apo Islanders changing their fishing practices and establishing an MPA?
- What do you think would have happened if they did not establish the MPA or change the way they used their island’s ocean resources?
3. View the National Geographic video “Galápagos” to build background.
Tell students that they will watch a short video (4 minutes, 30 seconds) to learn about the Galápagos Islands and the establishment of the Galápagos Marine Reserve. As they watch, focus their attention by telling them to look for examples of the case study information they will record in their charts. Tell them to think about the human impacts that threatened the habitat and organisms of the Galápagos and eventually led to the establishment of the MPA.
4. Review the Galápagos Marine Reserve Case Study.
After viewing the video, divide students into small groups and distribute copies of the handout Galápagos Marine Reserve Case Study. Have students read through the case study and complete the charts on their worksheets. Have groups share the information they recorded for each of the case study components in their charts. Next, ask students to brainstorm the human impacts (threats) that led to the creation of the Galápagos Marine Reserve as a MPA. Ask: Why did the Galápagos MPA need to be protected? List student responses on the board. Then ask students to recall the human impacts that led to the creation of Apo Island’s MPA. Draw a circle around the impacts that are the same as those threatening the Galápagos. Underline impacts that are different from those threatening the Galápagos. Lead a discussion about the similarities and differences between the two case studies, including the human impacts that threaten the balance and sustainability of their marine ecosystems.
5. Have students reflect on what they have learned.
- Based on the two case studies, what was done to address human-induced threats and restore balance in the marine ecosystems?
- Do you think more could or should be done to protect the habitat and organisms of the Galápagos and Apo Island? Why or why not?
- If the establishment of a MPA results in so many positive changes that benefit the people and the ocean, why are there not more MPAs throughout the world?

Learning Objectives
Students will:
- identify and describe human impacts to marine ecosystems
- summarize case study information, including the history, geography, habitats, species, human uses, stakeholders, and management goals for different MPAs
- discuss human actions that can be taken to restore balance to threatened marine ecosystems and species
Teaching Approach
- Learning-for-use
Teaching Methods
- Discussions
Skills Summary
This activity targets the following skills:
- Information, Communications, and Technology Literacy
- Communication and Collaboration
- Understanding
- Acquiring Geographic Information
- Organizing Geographic Information
Connections to National Standards, Principles, and Practices
National Geography Standards
- Standard 14 : How human actions modify the physical environment
- Standard 8 : The characteristics and spatial distribution of ecosystems and biomes on Earth's surface
National Science Education Standards
- (9-12) Standard F-3 : Natural resources
- (9-12) Standard F-4 : Environmental quality
- (9-12) Standard F-5 : Natural and human-induced hazards
Ocean Literacy Essential Principles and Fundamental Concepts
- Principle 6e : Humans affect the ocean in a variety of ways. Laws, regulations and resource management affect what is taken out and put into the ocean. Human development and activity leads to pollution (such as point source, non-point source, and noise pollution) and physical modifications (such as changes to beaches, shores and rivers). In addition, humans have removed most of the large vertebrates from the ocean.
- Principle 6g : Everyone is responsible for caring for the ocean. The ocean sustains life on Earth and humans must live in ways that sustain the ocean. Individual and collective actions are needed to effectively manage ocean resources for all.

Preparation
What you’ll need.
Materials You Provide
Required Technology
- Internet Access: Required
- Tech Setup: 1 computer per classroom, Projector, Speakers
- Plug-Ins: Flash
Physical Space
- Large-group instruction
- Small-group instruction
Other Notes
Before starting the activity, download and queue up the videos.
Media Credits
The audio, illustrations, photos, and videos are credited beneath the media asset, except for promotional images, which generally link to another page that contains the media credit. The Rights Holder for media is the person or group credited.
Educator Reviewers
Expert reviewers.
Special thanks to the educators who participated in National Geographic's 2010-2011 National Teacher Leadership Academy (NTLA), for testing activities in their classrooms and informing the content for all of the Ocean: Marine Ecology, Human Impacts, and Conservation resources.
Last Updated
August 20, 2024
User Permissions
For information on user permissions, please read our Terms of Service. If you have questions about how to cite anything on our website in your project or classroom presentation, please contact your teacher. They will best know the preferred format. When you reach out to them, you will need the page title, URL, and the date you accessed the resource.
If a media asset is downloadable, a download button appears in the corner of the media viewer. If no button appears, you cannot download or save the media.
Text on this page is printable and can be used according to our Terms of Service .
Interactives
Any interactives on this page can only be played while you are visiting our website. You cannot download interactives.
Tropical rainforest case study
Case study of a tropical rainforest setting to illustrate and analyse key themes in water and carbon cycles and their relationship to environmental change and human activity.
Amazon Forest The Amazon is the largest tropical rainforest on Earth. It sits within the Amazon River basin, covers some 40% of the South American continent and as you can see on the map below includes parts of eight South American countries: Brazil, Bolivia, Peru, Ecuador, Colombia, Venezuela, Guyana, and Suriname. The actual word “Amazon” comes from river. Amazing Amazon facts; • It is home to 1000 species of bird and 60,000 species of plants • 10 million species of insects live in the Amazon • It is home to 20 million people, who use the wood, cut down trees for farms and for cattle. • It covers 2.1 million square miles of land • The Amazon is home to almost 20% of species on Earth • The UK and Ireland would fit into the Amazon 17 times! The Amazon caught the public’s attention in the 1980s when a series of shocking news reports said that an area of rainforest the size of Belgium was being cut down and subsequently burnt every year. This deforestation has continued to the present day according to the Sao Paulo Space Research Centre. Current statistics suggest that we have lost 20% of Amazon rainforest. Their satellite data is also showing increased deforestation in parts of the Amazon.

Water The water cycle is very active within the Amazon rainforest and it interlinks the lithosphere, atmosphere and biosphere. The basin is drained by the Amazon River and its tributaries. The average discharge of water into the Atlantic Ocean by the Amazon is approximately 175,000 m 3 per second, or between 1/5th and 1/6th of the total discharge into the oceans of all of the world's rivers. 3 The Rio Negro, a tributary of the Amazon, is the second largest river in the world in terms of water flow, and is 100 meters deep and 14 kilometers wide near its mouth at Manaus, Brazil. Rainfall across the Amazon is very high. Average rainfall across the whole Amazon basin is approximately 2300 mm annually. In some areas of the northwest portion of the Amazon basin, yearly rainfall can exceed 6000 mm. 3 Only around 1/3 of the rain that falls in the Amazon basin is discharged into the Atlantic Ocean. It is thought that; 1. Up to half of the rainfall in some areas may never reach the ground, being intercepted by the forest and re-evaporated into the atmosphere. 2. Additional evaporation occurs from ground and river surfaces, or is released into the atmosphere by transpiration from plant leaves (in which plants release water from their leaves during photosynthesis) 3. This moisture contributes to the formation of rain clouds, which release the water back onto the rainforest. In the Amazon, 50-80 percent of moisture remains in the ecosystem’s water cycle. 4
This means that much of the rainfall re-enters the water cycling system of the Amazon, and a given molecule of water may be "re-cycled" many times between the time that it leaves the surface of the Atlantic Ocean and is carried by the prevailing westerly winds into the Amazon basin, to the time that it is carried back to the ocean by the Amazon River. 4 It is thought that the water cycle of the Amazon has global effects. The moisture created by rainforests travels around the world. Moisture created in the Amazon ends up falling as rain as far away as Texas, and forests in Southeast Asia influence rain patterns in south eastern Europe and China. 4 When forests are cut down, less moisture goes into the atmosphere and rainfall declines, sometimes leading to drought. These have been made worse by deforestation. 4 Change to the water and carbon cycles in the Amazon The main change to the Amazon rainforest is deforestation. Deforestation in the Amazon is generally the result of land clearances for; 1. Agriculture (to grow crops like Soya or Palm oil) or for pasture land for cattle grazing 2. Logging – This involves cutting down trees for sale as timber or pulp. The timber is used to build homes, furniture, etc. and the pulp is used to make paper and paper products. Logging can be either selective or clear cutting. Selective logging is selective because loggers choose only wood that is highly valued, such as mahogany. Clear-cutting is not selective. Loggers are interested in all types of wood and therefore cut all of the trees down, thus clearing the forest, hence the name- clear-cutting. 3. Road building – trees are also clear for roads. Roads are an essential way for the Brazilian government to allow development of the Amazon rainforest. However, unless they are paved many of the roads are unusable during the wettest periods of the year. The Trans Amazonian Highway has already opened up large parts of the forest and now a new road is going to be paved, the BR163 is a road that runs 1700km from Cuiaba to Santarem. The government planned to tarmac it making it a superhighway. This would make the untouched forest along the route more accessible and under threat from development. 4. Mineral extraction – forests are also cleared to make way for huge mines. The Brazilian part of the Amazon has mines that extract iron, manganese, nickel, tin, bauxite, beryllium, copper, lead, tungsten, zinc and gold! 5. Energy developmen t – This has focussed mainly on using Hydro Electric Power, and there are 150 new dams planned for the Amazon alone. The dams create electricity as water is passed through huge pipes within them, where it turns a turbine which helps to generate the electricity. The power in the Amazon is often used for mining. Dams displace many people and the reservoirs they create flood large area of land, which would previously have been forest. They also alter the hydrological cycle and trap huge quantities of sediment behind them. The huge Belo Monte dam started operating in April 2016 and will generate over 11,000 Mw of power. A new scheme the 8,000-megawatt São Luiz do Tapajós dam has been held up because of the concerns over the impacts on the local Munduruku people. 6. Settlement & population growth – populations are growing within the Amazon forest and along with them settlements. Many people are migrating to the forest looking for work associated with the natural wealth of this environment. Settlements like Parauapebas, an iron ore mining town, have grown rapidly, destroying forest and replacing it with a swath of shanty towns. The population has grown from 154,000 in 2010 to 220,000 in 2012. The Brazilian Amazon’s population grew by a massive 23% between 2000 and 2010, 11% above the national average.
The WWF estimates that 27 per cent, more than a quarter, of the Amazon biome will be without trees by 2030 if the current rate of deforestation continues. They also state that Forest losses in the Amazon biome averaged 1.4 million hectares per year between 2001 and 2012, resulting in a total loss of 17.7 million hectares, mostly in Brazil, Peru and Bolivia. 12
The impacts of deforestation Atmospheric impacts Deforestation causes important changes in the energy and water balance of the Amazon. Pasturelands and croplands (e.g. soya beans and corn) have a higher albedo and decreased water demand, evapotranspiration and canopy interception compared with the forests they replace. 9 Lathuillière et al. 10 found that forests in the state of Mato Grosso; • Contributed about 50 km 3 per year of evapotranspiration to the atmosphere in the year 2000. • Deforestation reduced that forest flux rate by approximately 1 km 3 per year throughout the decade. • As a result, by 2009, forests were contributing about 40 km 3 per year of evapotranspiration in Mato Grosso.
Differences such as these can affect atmospheric circulation and rainfall in proportion to the scale of deforestation The agriculture that replaces forest cover also decreases precipitation. In Rondônia, Brazil, one of the most heavily deforested areas of Brazil, daily rainfall data suggest that deforestation since the 1970s has caused an 18-day delay in the onset of the rainy season. 11 SSE Amazon also has many wild fires, which are closely associated with deforestation, forest fragmentation and drought intensity. According to Coe et al (2015) “ the increased atmospheric aerosol loads produced by fires have been shown to decrease droplet size, increase cloud height and cloud lifetime and inhibit rainfall, particularly in the dry season in the SSE Amazon. Thus, fires and drought may create a positive feedback in the SSE Amazon such that drought is more severe with continued deforestation and climate change .” 9

The impacts of climate change on the Amazon According to the WWF: • Some Amazon species capable of moving fast enough will attempt to find a more suitable environment. Many other species will either be unable to move or will have nowhere to go. • Higher temperatures will impact temperature-dependent species like fish, causing their distribution to change. • Reduced rainfall and increased temperatures may also reduce suitable habitat during dry, warm months and potentially lead to an increase in invasive, exotic species, which then can out-compete native species. • Less rainfall during the dry months could seriously affect many Amazon rivers and other freshwater systems. • The impact of reduced rainfall is a change in nutrient input into streams and rivers, which can greatly affect aquatic organisms. • A more variable climate and more extreme events will also likely mean that Amazon fish populations will more often experience hot temperatures and potentially lethal environmental conditions. • Flooding associated with sea-level rise will have substantial impacts on lowland areas such as the Amazon River delta. The rate of sea-level rise over the last 100 years has been 1.0-2.5 mm per year, and this rate could rise to 5 mm per year. • Sea-level rise, increased temperature, changes in rainfall and runoff will likely cause major changes in species habitats such as mangrove ecosystems. 15 Impacts of deforestation on soils Removing trees deprives the forest of portions of its canopy, which blocks the sun’s rays during the day, and holds in heat at night. This disruption leads to more extreme temperature swings that can be harmful to plants and animals. 8 Without protection from sun-blocking tree cover, moist tropical soils quickly dry out. In terms of Carbon, Tropical soils contain a lot of carbon. The top meter holds 66.9 PgC with around 52% of this carbon pool held in the top 0.3 m of the soil, the layer which is most prone to changes upon land use conversion and deforestation. 14 Deforestation releases much of this carbon through clearance and burning. For the carbon that remains in the soil, when it rains soil erosion will wash much of the carbon away into rivers after initial deforestation and some will be lost to the atmosphere via decomposition too.
Impacts of deforestation on Rivers Trees also help continue the water cycle by returning water vapor to the atmosphere. When trees are removed this cycle is severely disrupted and areas can suffer more droughts. There are many consequences of deforestation and climate change for the water cycle in forests; 1. There is increased soil erosion and weathering of rainforest soils as water acts immediately upon them rather than being intercepted. 2. Flash floods are more likely to happen as there is less interception and absorption by the forest cover. 3. Conversely, the interruption of normal water cycling has resulted in more droughts in the forest, increasing the risk of wild fires 4. More soil and silt is being washed into rivers, resulting in changes to waterways and transport 5. Disrupt water supplies to many people in Brazil
References 1 - Malhi, Y. et al. The regional variation of aboveground live biomass in old-growth Amazonian forests. Glob. Chang. Biol. 12, 1107–1138 (2006). 2 - Fernando D.B. Espírito-Santo et al. Size and frequency of natural forest disturbances and the Amazon forest carbon balance. Nature Communications volume 5, Article number: 3434 (2014) Accessed 3rd of January 2019 retrieved from https://www.nature.com/articles/ncomms4434#ref4 3 - Project Amazonas. Accessed 3rd of January 2019 retrieved from https://www.projectamazonas.org/amazon-facts 4 - Rhett Butler, 2012. IMPACT OF DEFORESTATION: LOCAL AND NATIONAL CONSEQUENCES. Accessed 3rd of January 2019 retrieved from https://rainforests.mongabay.com/0902.htm 5 – Mark Kinver. Amazon: 1% of tree species store 50% of region's carbon. 2015. BBC. Accessed 3rd of January 2019 retrieved from https://www.bbc.co.uk/news/science-environment-32497537 6 - Sophie Fauset et al. Hyperdominance in Amazonian forest carbon cycling. Nature Communications volume 6, Article number: 6857 (2015). Accessed 3rd of January 2019 retrieved from https://www.nature.com/articles/ncomms7857 7- Brienen, R.J.W et al. (2015) Long-term decline of the Amazon carbon sink, Nature, h ttps://www.nature.com/articles/nature14283 8 – National Geographic – Deforestation - Learn about the man-made and natural causes of deforestation–and how it's impacting our planet. Accessed 20th of January 2019 retrieved from https://www.nationalgeographic.com/environment/global-warming/deforestation/
9 - Michael T. Coe, Toby R. Marthews, Marcos Heil Costa, David R. Galbraith, Nora L. Greenglass, Hewlley M. A. Imbuzeiro, Naomi M. Levine, Yadvinder Malhi, Paul R. Moorcroft, Michel Nobre Muza, Thomas L. Powell, Scott R. Saleska, Luis A. Solorzano, and Jingfeng Wang. (2015) Deforestation and climate feedbacks threaten the ecological integrity of south–southeastern Amazonia. 368, Philosophical Transactions of the Royal Society B: Biological Sciences. Accessed 20th of January 2019 retrieved from http://rstb.royalsocietypublishing.org/content/368/1619/20120155
10 - Lathuillière MJ, Mark S, Johnson MS & Donner SD. (2012). Water use by terrestrial ecosystems: temporal variability in rainforest and agricultural contributions to evapotranspiration in Mato Grosso, Brazil. Environmental research Letters Volume 7 Number 2. http://iopscience.iop.org/article/10.1088/1748-9326/7/2/024024/meta
11- Nathalie Butt, Paula Afonso de Oliveira & Marcos Heil Costa (2011). Evidence that deforestation affects the onset of the rainy season in Rondonia, Brazil JGR Atmospheres, Volume 116, Issue D11. https://doi.org/10.1029/2010JD015174
12 – WWF, Amazon Deforestation. Accessed 20th of January 2019 retrieved from http://wwf.panda.org/our_work/forests/deforestation_fronts/deforestation_in_the_amazon/
13 - Berenguer, E., Ferreira, J., Gardner, T. A., Aragão, L. E. O. C., De Camargo, P. B., Cerri, C. E., Durigan, M., Oliveira, R. C. D., Vieira, I. C. G. and Barlow, J. (2014), A large-scale field assessment of carbon stocks in human-modified tropical forests. Global Change Biology, 20: 3713–3726. https://onlinelibrary.wiley.com/doi/full/10.1111/gcb.12627
14 - N.HBatjes, J.ADijkshoorn, (1999). Carbon and nitrogen stocks in the soils of the Amazon Region. Geoderma, Volume 89, Issues 3–4, Pages 273-286. Accessed 20th of January 2019 retrieved from https://www.sciencedirect.com/science/article/pii/S001670619800086X
15 – WWF, Impacts of climate change in the Amazon. Accessed 20th of January 2019 retrieved from http://wwf.panda.org/knowledge_hub/where_we_work/amazon/amazon_threats/climate_change_amazon/amazon_climate_change_impacts/
Written by Rob Gamesby
©2015 Cool Geography
- Copyright Policy
- Privacy & Cookies
- Testimonials
- Feedback & support
Thank you for visiting nature.com. You are using a browser version with limited support for CSS. To obtain the best experience, we recommend you use a more up to date browser (or turn off compatibility mode in Internet Explorer). In the meantime, to ensure continued support, we are displaying the site without styles and JavaScript.
- View all journals
- Explore content
- About the journal
- Publish with us
- Sign up for alerts
- Open access
- Published: 02 September 2024
Green spaces provide substantial but unequal urban cooling globally
- Yuxiang Li 1 ,
- Jens-Christian Svenning ORCID: orcid.org/0000-0002-3415-0862 2 ,
- Weiqi Zhou ORCID: orcid.org/0000-0001-7323-4906 3 , 4 , 5 ,
- Kai Zhu ORCID: orcid.org/0000-0003-1587-3317 6 ,
- Jesse F. Abrams ORCID: orcid.org/0000-0003-0411-8519 7 ,
- Timothy M. Lenton ORCID: orcid.org/0000-0002-6725-7498 7 ,
- William J. Ripple 8 ,
- Zhaowu Yu ORCID: orcid.org/0000-0003-4576-4541 9 ,
- Shuqing N. Teng 1 ,
- Robert R. Dunn 10 &
- Chi Xu ORCID: orcid.org/0000-0002-1841-9032 1
Nature Communications volume 15 , Article number: 7108 ( 2024 ) Cite this article
146 Altmetric
Metrics details
- Climate-change mitigation
- Urban ecology
Climate warming disproportionately impacts countries in the Global South by increasing extreme heat exposure. However, geographic disparities in adaptation capacity are unclear. Here, we assess global inequality in green spaces, which urban residents critically rely on to mitigate outdoor heat stress. We use remote sensing data to quantify daytime cooling by urban greenery in the warm seasons across the ~500 largest cities globally. We show a striking contrast, with Global South cities having ~70% of the cooling capacity of cities in the Global North (2.5 ± 1.0 °C vs. 3.6 ± 1.7 °C). A similar gap occurs for the cooling adaptation benefits received by an average resident in these cities (2.2 ± 0.9 °C vs. 3.4 ± 1.7 °C). This cooling adaptation inequality is due to discrepancies in green space quantity and quality between cities in the Global North and South, shaped by socioeconomic and natural factors. Our analyses further suggest a vast potential for enhancing cooling adaptation while reducing global inequality.
Global climate-driven trade-offs between the water retention and cooling benefits of urban greening

Water, energy and climate benefits of urban greening throughout Europe under different climatic scenarios

Greenery as a mitigation and adaptation strategy to urban heat
Introduction.
Heat extremes are projected to be substantially intensified by global warming 1 , 2 , imposing a major threat to human mortality and morbidity in the coming decades 3 , 4 , 5 , 6 . This threat is particularly concerning as a majority of people now live in cities 7 , including those cities suffering some of the hottest climate extremes. Cities face two forms of warming: warming due to climate change and warming due to the urban heat island effect 8 , 9 , 10 . These two forms of warming have the potential to be additive, or even multiplicative. Climate change in itself is projected to result in rising maximum temperatures above 50 °C for a considerable fraction of the world if 2 °C global warming is exceeded 2 ; the urban heat island effect will cause up to >10 °C additional (surface) warming 11 . Exposures to temperatures above 35 °C with high humidity or above 40 °C with low humidity can lead to lethal heat stress for humans 12 . Even before such lethal temperatures are reached, worker productivity 13 and general health and well-being 14 can suffer. Heat extremes are especially risky for people living in the Global South 15 , 16 due to warmer climates at low latitudes. Climate models project that the lethal temperature thresholds will be exceeded with increasing frequencies and durations, and such extreme conditions will be concentrated in low-latitude regions 17 , 18 , 19 . These low-latitude regions overlap with the major parts of the Global South where population densities are already high and where population growth rates are also high. Consequently, the number of people exposed to extreme heat will likely increase even further, all things being equal 16 , 20 . That population growth will be accompanied by expanded urbanization and intensified urban heat island effects 21 , 22 , potentially exacerbating future Global North-Global South heat stress exposure inequalities.
Fortunately, we know that heat stress can be buffered, in part, by urban vegetation 23 . Urban green spaces, and especially urban forests, have proven an effective means through which to ameliorate heat stress through shading 24 , 25 and transpirational cooling 26 , 27 . The buffering effect of urban green spaces is influenced by their area (relative to the area of the city) and their spatial configuration 28 . In this context, green spaces become a kind of infrastructure that can and should be actively managed. At broad spatial scales, the effect of this urban green infrastructure is also mediated by differences among regions, whether in their background climate 29 , composition of green spaces 30 , or other factors 31 , 32 , 33 , 34 . The geographic patterns of the buffering effects of green spaces, whether due to geographic patterns in their areal extent or region-specific effects, have so far been poorly characterized.
On their own, the effects of climate change and urban heat islands on human health are likely to become severe. However, these effects will become even worse if they fall disproportionately in cities or countries with less economic ability to invest in green space 35 or in other forms of cooling 36 , 37 . A number of studies have now documented the so-called ‘luxury effect,’ wherein lower-income parts of cities tend to have less green space and, as a result, reduced biodiversity 38 , 39 . Where the luxury effect exists, green space and its benefits become, in essence, a luxury good 40 . If the luxury effect holds among cities, and lower-income cities also have smaller green spaces, the Global South may have the least potential to mitigate the combined effects of climate warming and urban heat islands, leading to exacerbated and rising inequalities in heat exposure 41 .
Here, we assess the global inequalities in the cooling capability of existing urban green infrastructure across urban areas worldwide. To this end, we use remotely sensed data to quantify three key variables, i.e., (1) cooling efficiency, (2) cooling capacity, and (3) cooling benefit of existing urban green infrastructure for ~500 major cities across the world. Urban green infrastructure and temperature are generally negatively and relatively linearly correlated at landscape scales, i.e., higher quantities of urban green infrastructure yield lower temperatures 42 , 43 . Cooling efficiency is widely used as a measure of the extent to which a given proportional increase in the area of urban green infrastructure leads to a decrease in temperature, i.e., the slope of the urban green infrastructure-temperature relationship 42 , 44 , 45 (see Methods for details). This simple metric allows quantifying the quality of urban green infrastructure in terms of ameliorating the urban heat island effect. Meanwhile, the extent to which existing urban green infrastructure cools down an entire city’s surface temperatures (compared to the non-vegetated built-up areas) is referred to as cooling capacity. Hence, cooling capacity is a function of the total quantity of urban green infrastructure and its cooling efficiency (see Methods).
As a third step, we account for the spatial distributions of urban green infrastructure and populations to quantify the benefit of cooling mitigation received by an average urban inhabitant in each city given their location. This cooling benefit is a more direct measure of the cooling realized by people, after accounting for the within-city geography of urban green infrastructure and population density. We focus on cooling capacity and cooling benefit as the measures of the cooling capability of individual cities for assessing their global inequalities. We are particularly interested in linking cooling adaptation inequality with income inequality 40 , 46 . While this can be achieved using existing income metrics for country classifications 47 , here we use the traditional Global North/South classification due to its historical ties to geography which is influential in climate research.
Results and discussion
Our analyses indicate that existing green infrastructure of an average city has a capability of cooling down surface temperatures by ~3 °C during warm seasons. However, a concerning disparity is evident; on average Global South cities have only two-thirds the cooling capacity and cooling benefit compared to Global North cities. This inequality is attributable to the differences in both quantity and quality of existing urban green infrastructure among cities. Importantly, we find that there exists considerable potential for many cities to enhance the cooling capability of their green infrastructure; achieving this potential could dramatically reduce global inequalities in adaptation to outdoor heat stress.
Quantifying cooling inequality
Our analyses showed that both the quantity and quality of the existing urban green infrastructure vary greatly among the world’s ~500 most populated cities (see Methods for details, and Fig. 1 for examples). The quantity of urban green infrastructure measured based on remotely sensed indicators of spectral greenness (Normalized Difference Vegetation Index, NDVI, see Methods) had a coefficient of variation (CV) of 35%. Similarly, the quality of urban green infrastructure in terms of cooling efficiency (daytime land surface temperatures during peak summer) had a CV of 37% (Supplementary Figs. 1 , 2 ). The global mean value of cooling capacity is 2.9 °C; existing urban green infrastructure ameliorates warm-season heat stress by 2.9 °C of surface temperature in an average city. In truth, however, the variation in cooling capacity was great (global CV in cooling capacity as large as ~50%), such that few cities were average. This variation is strongly geographically structured. Cities closer to the equator - tropical and subtropical cities - tend to have relatively weak cooling capacities (Fig. 2a, b ). As Global South countries are predominantly located at low latitudes, this pattern leads to a situation in which Global South cities, which tend to be hotter and relatively lower-income, have, on average, approximately two-thirds the cooling capacity of the Global North cities (2.5 ± 1.0 vs. 3.6 ± 1.7°C, Wilcoxon test, p = 2.7e-12; Fig. 2c ). The cities that most need to rely on green infrastructure are, at present, those that are least able to do so.

a , e , i , m , q Los Angeles, US. b , f , j , n , r Paris, France. c , g , k , o , s Shanghai, China. d , h , l , p , t Cairo, Egypt. Local cooling efficiency is calculated for different local climate zone types to account for within-city heterogeneity. In densely populated parts of cities, local cooling capacity tends to be lower due to reduced green space area, whereas local cooling benefit (local cooling capacity multiplied by a weight term of local population density relative to city mean) tends to be higher as more urban residents can receive cooling amelioration.

a Global distribution of cooling capacity for the 468 major urbanized areas. b Latitudinal pattern of cooling capacity. c Cooling capacity difference between the Global North and South cities. The cooling capacity offered by urban green infrastructure evinces a latitudinal pattern wherein lower-latitude cities have weaker cooling capacity ( b , cubic-spline fitting of cooling capacity with 95% confidence interval is shown), representing a significant inequality between Global North and South countries: city-level cooling capacity for Global North cities are about 1.5-fold higher than in Global South cities ( c ). Data are presented as box plots, where median values (center black lines), 25th percentiles (box lower bounds), 75th percentiles (box upper bounds), whiskers extending to 1.5-fold of the interquartile range (IQR), and outliers are shown. The tails of the cooling capacity distributions are truncated at zero as all cities have positive values of cooling capacity. Notice that no cities in the Global South have a cooling capacity greater than 5.5 °C ( c ). This is because no cities in the Global South have proportional green space areas as great as those seen in the Global North (see also Fig. 4b ). A similar pattern is found for cooling benefit (Supplementary Fig. 3 ). The two-sided non-parametric Wilcoxon test was used for statistical comparisons.
When we account for the locations of urban green infrastructure relative to humans within cities, the cooling benefit of urban green infrastructure realized by an average urban resident generally becomes slightly lower than suggested by cooling capacity (see Methods; Supplementary Fig. 3 ). Urban residents tend to be densest in the parts of cities with less green infrastructure. As a result, the average urban resident experiences less cooling amelioration than expected. However, this heterogeneity has only a minor effect on global-scale inequality. As a result, the geographic trends in cooling capacity and cooling benefit are similar: mean cooling benefit for an average urban resident also presents a 1.5-fold gap between Global South and North cities (2.2 ± 0.9 vs. 3.4 ± 1.7 °C, Wilcoxon test, p = 3.2e-13; Supplementary Fig. 3c ). Urban green infrastructure is a public good that has the potential to help even the most marginalized populations stay cool; unfortunately, this public benefit is least available in the Global South. When walking outdoors, the average person in an average Global South city receives only two-thirds the cooling amelioration from urban green infrastructure experienced by a person in an average Global North city. The high cooling amelioration capacity and benefit of the Global North cities is heavily influenced by North America (specifically, Canada and the US), which have both the highest cooling efficiency and the largest area of green infrastructure, followed by Europe (Supplementary Fig. 4 ).
One way to illustrate the global inequality of cooling capacity or benefit is to separately look at the cities that are most and least effective in ameliorating outdoor heat stress. Our results showed that ~85% of the 50 most effective cities (with highest cooling capacity or cooling benefit) are located in the Global North, while ~80% of the 50 least effective are Global South cities (Fig. 3 , Supplementary Fig. 5 ). This is true without taking into account the differences in the background temperatures and climate warming of these cities, which will exacerbate the effects on human health; cities in the Global South are likely to be closer to the limits of human thermal comfort and even, increasingly, the limits of the temperatures and humidities (wet-bulb temperatures) at which humans can safely work or even walk, such that the ineffectiveness of green spaces in those cities in cooling will lead to greater negative effects on human health 48 , work 14 , and gross domestic product (GDP) 49 . In addition, Global South cities commonly have higher population densities (Fig. 3 , Supplementary Fig. 5 ) and are projected to have faster population growth 50 . This situation will plausibly intensify the urban heat island effect because of the need of those populations for housing (and hence tensions between the need for buildings and the need for green spaces). It will also increase the number of people exposed to extreme urban heat island effects. Therefore, it is critical to increase cooling benefit via expanding urban green spaces, so that more people can receive the cooling mitigation from a given new neighboring green space if they live closer to each other. Doing so will require policies that incentivize urban green spaces as well as architectural innovations that make innovations such as plant-covered buildings easier and cheaper to implement.

The axes on the right are an order of magnitude greater than those on the left, such that the cooling capacity of Charlotte in the United States is about 37-fold greater than that of Mogadishu (Somalia) and 29-fold greater than that of Sana’a (Yemen). The cities presenting lowest cooling capacities are most associated with Global South cities at higher population densities.
Of course, cities differ even within the Global North or within the Global South. For example, some Global South cities have high green space areas (or relatively high cooling efficiency in combination with moderate green space areas) and hence high cooling capacity. These cities, such as Pune (India), will be important to study in more detail, to shed light on the mechanistic details of their cooling abilities as well as the sociopolitical and other factors that facilitated their high green area coverage and cooling capabilities (Supplementary Figs. 6 , 7 ).
We conducted our primary analyses using a spatial grain of 100-m grid cells and Landsat NDVI data for quantifying spectral greenness. Our results, however, were robust at the coarser spatial grain of 1 km. We find a slightly larger global cooling inequality (~2-fold gap between Global South and North cities) at the 1-km grain using MODIS data (see Methods and Supplementary Fig. 17 ). MODIS data have been frequently used for quantifying urban heat island effects and cooling mitigation 44 , 45 , 51 . Our results reinforce its robustness for comparing urban thermal environments between cities across broad scales.
Influencing factors
The global inequality of cooling amelioration could have a number of proximate causes. To understand their relative influence, we first separately examined the effects of quality (cooling efficiency) and quantity (NDVI as a proxy indicator of urban green space area) of urban green infrastructure. The simplest null model is one in which cooling capacity (at the city scale) and cooling benefit (at the human scale) are driven primarily by the proportional area in a city dedicated to green spaces. Indeed, we found that both cooling capacity and cooling benefit were strongly correlated with urban green space area (Fig. 4 , Supplementary Fig. 8 ). This finding is useful with regards to practical interventions. In general, cities that invest in saving or restoring more green spaces will receive more cooling benefits from those green spaces. By contrast, differences among cities in cooling efficiency played a more minor role in determining the cooling capacity and benefit of cities (Fig. 4 , Supplementary Fig. 8 ).

a Relationship between cooling efficiency and cooling capacity. b Relationship between green space area (measured by mean Landsat NDVI in the hottest month of 2018) and cooling capacity. Note that the highest level of urban green space area in the Global South cities is much lower than that in the Global North (dashed line in b ). Gray bands indicate 95% confidence intervals. Two-sided t-tests were conducted. c A piecewise structural equation model based on assumed direct and indirect (through influencing cooling efficiency and urban green space area) effects of essential natural and socioeconomic factors on cooling capacity. Mean annual temperature and precipitation, and topographic variation (elevation range) are selected to represent basic background natural conditions; GDP per capita is selected to represent basic socioeconomic conditions. The spatial extent of built-up areas is included to correct for city size. A bi-directional relationship (correlation) is fitted between mean annual temperature and precipitation. Red and blue solid arrows indicate significantly negative and positive coefficients with p ≤ 0.05, respectively. Gray dashed arrows indicate p > 0.05. The arrow width illustrates the effect size. Similar relationships are found for cooling benefits realized by an average urban resident (see Supplementary Fig. 8 ).
A further question is what shapes the quality and quantity of urban green infrastructure (which in turn are driving cooling capacity)? Many inter-correlated factors are possibly operating at multiple scales, making it difficult to disentangle their effects, especially since experiment-based causal inference is usually not feasible for large-scale urban systems. From a macroscopic perspective, we test the simple hypothesis that the background natural and socioeconomic conditions of cities jointly affect their cooling capacity and benefit in both direct and indirect ways. To this end, we constructed a minimal structural equation model including only the most essential variables reflecting background climate (mean annual temperature and precipitation), topographic variation (elevation range), as well as gross domestic product (GDP) per capita and city area (see Methods; Fig. 4c ).
We found that the quantity of green spaces in a city (again, in proportion to its size) was positively correlated with GDP per capita and city area; wealthier cities have more green spaces. It is well known that wealth and green spaces are positively correlated within cities (the luxury effect) 40 , 46 ; our analysis shows that a similar luxury effect occurs among them at a global scale. In addition, larger cities often have proportionally more green spaces, an effect that may be due to the tendency for large cities (particularly in the US and Canada) to have lower population densities. Cities that were hotter and had more topographic variation tended to have fewer green spaces and those that were more humid tended to have more green spaces. Given that temperature and humidity are highly correlated with the geography of the Global South and Global North, it is difficult to know whether these effects are due to the direct effects of temperature and precipitation, for example, on the growth rate of vegetation and hence the transition of abandoned lots into green spaces, or are associated with historical, cultural and political differences that via various mechanisms correlate to climate. Our structural equation model explained only a small fraction of variation among cities in their cooling efficiency, which is to say the quality of their green space. Cooling efficiency was modestly influenced by background temperature and precipitation—the warmer a city, the greater the cooling efficiency in that city; conversely, the more humid a city the less the cooling efficiency of that city.
Our analyses suggested that the lower cooling adaptation capabilities of Global South cities can be explained by their lower quantity of green infrastructure and, to a much lesser extent, their weaker cooling efficiency (quality; Supplementary Fig. 2 ). These patterns appear to be in part structured by GDP, but are also associated with climatic conditions 39 , and other factors. A key question, unresolved by our work, is whether the climatic correlates of the size of green spaces in cities are due to the effects of climate per se or if they, instead, reflect correlates between contemporary climate and the social, cultural, and political histories of cities in the Global South 52 . Since urban planning has much inertia, especially in big cities, those choices might be correlated with climate because of the climatic correlates of political histories. It is also possible that these dynamics relate, in part, to the ways in which climate influences vegetation structure. However, this seems less likely given that under non-urban conditions vegetation cover (and hence cooling capacity) is normally positively correlated with mean annual temperature across the globe, opposite to our observed negative relationships for urban systems (Supplementary Fig. 9g ). Still, it is possible that increased temperatures in cities due to the urban heat island effects may lead to temperature-vegetation cover-cooling capacity relationships that differ from those in natural environments 53 , 54 . Indeed, a recent study found that climate warming will put urban forests at risk, and the risk is disproportionately higher in the Global South 55 .
Our model serves as a starting point for unraveling the mechanisms underlying global cooling inequality. We cannot rule out the possibility that other unconsidered factors correlated with the studied variables play important roles. We invite systematic studies incorporating detailed sociocultural and ecological variables to address this question across scales.
Potential of enhancing cooling and reducing inequality
Can we reduce the inequality in cooling capacity and benefits that we have discovered among the world’s largest cities? Nuanced assessments of the potential to improve cooling mitigation require comprehensive considerations of socioeconomic, cultural, and technological aspects of urban management and policy. It is likely that cities differ greatly in their capacity to implement cooling through green infrastructure, whether as a function of culture, governance, policy or some mix thereof. However, any practical attempts to achieve greater cooling will occur in the context of the realities of climate and existing land use. To understand these realities, we modeled the maximum additional cooling capacity that is possible in cities, given existing constraints. We assume that this capacity depends on the quality (cooling efficiency) and quantity of urban green infrastructure. Our approach provides a straightforward metric of the cooling that could be achieved if all parts of a city’s green infrastructure were to be enhanced systematically.
The positive outlook is that our analyses suggest a considerable potential of improving cooling capacity by optimizing urban green infrastructure. An obvious way is through increases in urban green infrastructure quantity. We employ an approach in which we consider each local climate zone 56 to have a maximum NDVI and cooling efficiency (see Methods). For a given local climate zone, the city with the largest NDVI values or cooling efficiency sets the regional upper bounds for urban green infrastructure quantities or quality that can be achieved. Notably, these maxima are below the maxima for forests or other non-urban spaces for the simple reason that, as currently imagined, cities must contain gray (non-green) spaces in the form of roads and buildings. In this context, we conduct a thought experiment. What if we could systematically increase NDVI of all grid cells in each city, per local climate zone type, to a level corresponding to the median NDVI of grid cells in that upper bound city while keeping cooling efficiency unchanged (see Methods). If we were able to achieve this goal, the cooling capacity of cities would increase by ~2.4 °C worldwide. The increase would be even greater, ~3.8°C, if the 90th percentile (within the reference maximum city) was reached (Fig. 5a ). The potential for cooling benefit to the average urban resident is similar to that of cooling capacity (Supplementary Fig. 10a ). There is also potential to reduce urban temperatures if we can enhance cooling efficiency. However, the benefits of increases in cooling efficiency are modest (~1.5 °C increases at the 90th percentile of regional upper bounds) when holding urban green infrastructure quantity constant. In theory, if we could maximize both quantity and cooling efficiency of urban green infrastructure (to 90th percentiles of their regional upper bounds respectively), we would yield increases in cooling capacity and benefit up to ~10 °C, much higher than enhancing green space area or cooling efficiency alone (Fig. 5a , Supplementary Fig. 10a ). Notably, such co-maximization of green space area and cooling efficiency would substantially reduce global inequality to Gini <0.1 (Fig. 5b , Supplementary Fig. 10b ). Our analyses thus provide an important suggestion that enhancing both green space quantity and quality can yield a synergistic effect leading to much larger gains than any single aspect alone.

a The potential of enhancing cooling capacity via either enhancing urban green infrastructure quality (i.e., cooling efficiency) while holding quantity (i.e., green space area) fixed (yellow), or enhancing quantity while holding quality fixed (blue) is much lower than that of enhancing both quantity and quality (green). The x-axis indicates the targets of enhancing urban green infrastructure quantity and/or quality relative to the 50–90th percentiles of NDVI or cooling efficiency, see Methods). The dashed horizontal lines indicate the median cooling capacity of current cities. Data are presented as median values with the colored bands corresponding to 25–75th percentiles. b The potential of reducing cooling capacity inequality is also higher when enhancing both urban green infrastructure quantity and quality. The Gini index weighted by population density is used to measure inequality. Similar results were found for cooling benefit (Supplementary Fig. 10 ).
Different estimates of cooling capacity potential may be reached based on varying estimates and assumptions regarding the maximum possible quantity and quality of urban green infrastructure. There is no single, simple way to make these estimates, especially considering the huge between-city differences in society, culture, and structure across the globe. Our example case (above) begins from the upper bound city’s median NDVI, taking into account different local climate zone types and background climate regions (regional upper bounds). This is based on the assumption that for cities within the same climate regions, their average green space quantity may serve as an attainable target. Still, urban planning is often made at the level of individual cities, often only implemented to a limited extent and made with limited consideration of cities in other regions and countries. A potentially more realistic reference may be taken from the existing green infrastructure (again, per local climate zone type) within each particular city itself (see Methods): if a city’s sparsely vegetated areas was systematically elevated to the levels of 50–90th percentiles of NDVI within their corresponding local climate zones within the city, cooling capacity would still increase, but only by 0.5–1.5 °C and with only slightly reduced inequalities among cities (Supplementary Fig. 11 ). This highlights that ambitious policies, inspired by the greener cities worldwide, are necessary to realize the large cooling potential in urban green infrastructure.
In summary, our results demonstrate clear inequality in the extent to which urban green infrastructure cools cities and their denizens between the Global North and South. Much attention has been paid to the global inequality of indoor heat adaptation arising from the inequality of resources (e.g., less affordable air conditioning and more frequent power shortages in the Global South) 36 , 57 , 58 , 59 . Our results suggest that the inequality in outdoor adaptation is particularly concerning, especially as urban populations in the Global South are growing rapidly and are likely to face the most severe future temperature extremes 60 .
Previous studies have been focusing on characterizing urban heat island effects, urban vegetation patterns, resident exposure, and cooling effects in particular cities 26 , 28 , 34 , 61 , regions 22 , 25 , 62 , or continents 32 , 44 , 63 . Recent studies start looking at global patterns with respect to cooling efficiency or green space exposure 35 , 45 , 64 , 65 . Our approach is one drawn from the fields of large-scale ecology and macroecology. This approach is complementary to and, indeed, can, in the future, be combined with (1) mechanism driven biophysical models 66 , 67 to predict the influence of the composition and climate of green spaces on their cooling efficiency, (2) social theory aimed at understanding the factors that govern the amount of green space in cities as well as the disparity among cities 68 , (3) economic models of the effects of policy changes on the amount of greenspace and even (4) artist-driven projects that seek to understand the ways in which we might reimagine future cities 69 . Our simple explanatory model is, ultimately, one lens on a complex, global phenomenon.
Our results convey some positive outlook in that there is considerable potential to strengthen the cooling capability of cities and to reduce inequalities in cooling capacities at the same time. Realizing this nature-based solution, however, will be challenging. First, enhancing urban green infrastructure requires massive investments, which are more difficult to achieve in Global South cities. Second, it also requires smart planning strategies and advanced urban design and greening technologies 37 , 70 , 71 , 72 . Spatial planning of urban green spaces needs to consider not only the cooling amelioration effect, but also their multifunctional aspects that involve multiple ecosystem services, mental health benefits, accessibility, and security 73 . In theory, a city can maximize its cooling while also maximizing density through the combination of high-density living, ground-level green spaces, and vertical and rooftop gardens (or even forests). In practice, the current cities with the most green spaces tend to be lower-density cities 74 (Supplementary Fig. 12 ). Still, innovation and implementation of new technologies that allow green spaces and high-density living to be combined have the potential to reduce or disconnect the negative relationship between green space area and population density 71 , 75 . However, this development has yet to be realized. Another dimension of green spaces that deserves more attention is the geography of green spaces relative to where people are concentrated within cities. A critical question is how best should we distribute green spaces within cities to maximize cooling efficiency 76 and minimize within-city cooling inequality towards social equity 77 ? Last but not least, it is crucial to design and manage urban green spaces to be as resilient as possible to future climate stress 78 . For many cities, green infrastructure is likely to remain the primary means people will have to rely on to mitigate the escalating urban outdoor heat stress in the coming decades 79 .
We used the world population data from the World’s Cities in 2018 Data Booklet 80 to select 502 major cities with population over 1 million people (see Supplementary Data 1 for the complete list of the studied cities). Cities are divided into the Global North and Global South based on the Human Development Index (HDI) from the Human Development Report 2019 81 . For each selected city, we used the 2018 Global Artificial Impervious Area (GAIA) data at 30 m resolution 82 to determine its geographic extent. The derived urban boundary polygons thus encompass a majority of the built-up areas and urban residents. In using this approach, rather than urban administrative boundaries, we can focus on the relatively densely populated areas where cooling mitigation is most needed, and exclude areas dominated by (semi) natural landscapes that may bias the subsequent quantifications of the cooling effect. Our analyses on the cooling effect were conducted at the 100 m spatial resolution using Landsat data and WorldPop Global Project Population Data of 2018 83 . In order to test for the robustness of the results to coarser spatial scales, we also repeated the analyses at 1 km resolution using MODIS data, which have been extensively used for quantifying urban heat island effects and cooling mitigation 44 , 45 , 51 . We discarded the five cities with sizes <30 km 2 as they were too small for us to estimate their cooling efficiency based on linear regression (see section below for details). We combined closely located cities that form contiguous urban areas or urban agglomerations, if their urban boundary polygons from GAIA merged (e.g., Phoenix and Mesa in the United States were combined). Our approach yielded 468 polygons, each representing a major urbanized area that were the basis for all subsequent analyses. Because large water bodies can exert substantial and confounding cooling effects, we excluded permanent water bodies including lakes, reservoirs, rivers, and oceans using the Copernicus Global Land Service (CGLS) Land Cover data for 2018 at 10 m resolution 84 .
Quantifying the cooling effect
As a first step, we calculated cooling efficiency for each studied city within the GAIA-derived urban boundary. Cooling efficiency quantifies the extent to which a given area of green spaces in a city can reduce temperatures. It is a measure of the effectiveness (quality) of urban green spaces in terms of heat amelioration. Cooling efficiency is typically measured by calculating the slope of the relationship between remotely-sensed land surface temperature (LST) and vegetation cover through ordinary least square regression 42 , 44 , 45 . It is known that cooling efficiency varies between cities. Influencing factors might include background climate 29 , species composition 30 , 85 , landscape configuration 28 , topography 86 , proximity to large water bodies 33 , 87 , urban morphology 88 , and city management practices 31 . However, the mechanism underlying the global pattern of cooling efficiency remains unclear.
We used Landsat satellite data provided by the United States Geological Survey (USGS) to calculate the cooling efficiency of each studied city. We used the cloud-free Landsat 8 Level 2 LST and NDVI data. For each city we calculated the mean LST in each month of 2018 to identify the hottest month, and then derived the hottest month LST; we used the cloud-free Landsat 8 data to calculate the mean NDVI for the hottest month correspondingly.
We quantified cooling efficiency for different local climate zones 56 separately for each city, to account for within-city variability of thermal environments. To this end, we used the Copernicus Global Land Service data (CGLS) 84 and Global Human Settlement Layers (GHSL) Built-up height data 89 of 2018 at the 100 m resolution to identify five types of local climate zones: non-tree vegetation (shrubs, herbaceous vegetation, and cultivated vegetation according to the CGLS classification system), low-rise buildings (built up and bare according to the CGLS classification system, with building heights ≤10 m according to the GHSL data), medium-high-rise buildings (built up and bare areas with building heights >10 m), open tree cover (open forest with tree cover 15–70% according to the CGLS system), and closed tree cover (closed forest with tree cover >70%).
For each local climate zone type in each city, we constructed a regression model with NDVI as the predictor variable and LST as the response variable (using the ordinary least square method). We took into account the potential confounding factors including topographic elevation (derived from MERIT DEM dataset 90 ), building height (derived from the GHSL dataset 89 ), and distance to water bodies (derived from the GSHHG dataset 91 ), the model thus became: LST ~ NDVI + topography + building height + distance to water. Cooling efficiency was calculated as the absolute value of the regression coefficient of NDVI, after correcting for those confounding factors. To account for the multi-collinearity issue, we conducted variable selection based on the variance inflation factor (VIF) to achieve VIF < 5. Before the analysis, we discarded low-quality Landsat pixels, and filtered out the pixels with NDVI < 0 (normally less than 1% in a single city). Cooling efficiency is known to be influenced by within-city heterogeneity 92 , 93 , and, as a result, might sometimes better fit non-linear relationships at local scales 65 , 76 . However, our central aim is to assess global cooling inequality based on generalized relationships that fit the majority of global cities. Previous studies have shown that linear relationships can do this job 42 , 44 , 45 , therefore, here we used linear models to assess cooling efficiency.
As a second step, we calculated the cooling capacity of each city. Cooling capacity is a positive function of the magnitude of cooling efficiency and the proportional area of green spaces in a city and is calculated based on NDVI and the derived cooling efficiency (Eq. 1 , Supplementary Fig. 13 ):
where CC lcz and CE lcz are the cooling capacity and cooling efficiency for a given local climate zone type in a city, respectively; NDVI i is the mean NDVI for 100-m grid cell i ; NDVI min is the minimum NDVI across the city; and n is the total number of grid cells within the local climate zone. Local cooling capacity for each grid cell i (Fig. 1 , Supplementary Fig. 7 ) can be derived in this way as well (Supplementary Fig. 13 ). For a particular city, cooling capacity may be dependent on the spatial configuration of its land use/cover 28 , 94 , but here we condensed cooling capacity to city average (Eq. 2 ), thus did not take into account these local-scale factors.
where CC is the average cooling capacity of a city; n lcz is the number of grid cells of the local climate zone; m is the total number of grid cells within the whole city.
As a third step, we calculated the cooling benefit realized by an average urban resident (cooling benefit in short) in each city. Cooling benefit depends not only on the cooling capacity of a city, but also on where people live within a city relative to greener or grayer areas of the city. For example, cooling benefits in a city might be low even if the cooling capacity is high if the green parts and the dense-population parts of a city are inversely correlated. Here, we are calculating these averages while aware that in any particular city the exposure of a particular person will depend on the distribution of green spaces in a city, and the occupation, movement trajectories of a person, etc. On the scale of a city, we calculated cooling benefit following a previous study 35 , that is, simply adding a weight term of population size per 100-m grid cell into cooling capacity in Eq. ( 1 ):
Where CB lcz is the cooling benefit of a given local climate zone type in a specific city, pop i is the number of people within grid cell i , \(\overline{{pop}}\) is the mean population of the city.
Where CB is the average cooling benefit of a city. The population data were obtained from the 100-m resolution WorldPop Global Project Population Data of 2018 83 . Local cooling benefit for a given grid cell i can be calculated in a similar way, i.e., local cooling capacity multiplied by a weight term of local population density relative to mean population density. Local cooling benefits were mapped for example cities for the purpose of illustrating the effect of population spatial distribution (Fig. 1 , Supplementary Fig. 7 ), but their patterns were not examined here.
Based on the aforementioned three key variables quantified at 100 m grid cells, we conducted multivariate analyses to examine if and to what extent cooling efficiency and cooling benefit are shaped by essential natural and socioeconomic factors, including background climate (mean annual temperature from ECMWF ERA5 dataset 95 and precipitation from TerraClimate dataset 96 ), topography (elevation range 90 ), and GDP per capita 97 , with city size (geographic extent) corrected for. We did not include humidity because it is strongly correlated with temperature and precipitation, causing serious multi-collinearity problems. We used piecewise structural equation modeling to test the direct effects of these factors and indirect effects via influencing cooling efficiency and vegetation cover (Fig. 4c , Supplementary Fig. 8c ). To account for the potential influence of spatial autocorrelation, we used spatially autoregressive models (SAR) to test for the robustness of the observed effects of natural and socioeconomic factors on cooling capacity and benefit (Supplementary Fig. 14 ).
Testing for robustness
We conducted the following additional analyses to test for robustness. We obtained consistent results from these robustness analyses.
(1) We looked at the mean hottest-month LST and NDVI within 3 years (2017-2019) to check the consistency between the results based on relatively short (1 year) vs. long (3-year average) time periods (Supplementary Fig. 15 ).
(2) We carried out the approach at a coarser spatial scale of 1 km, using MODIS-derived NDVI and LST, as well as the population data 83 in the hottest month of 2018. In line with our finer-scale analysis of Landsat data, we selected the hottest month and excluded low-quality grids affected by cloud cover and water bodies 98 (water cover > 20% in 1 × 1 km 2 grid cells) of MODIS LST, and calculated the mean NDVI for the hottest month. We ultimately obtained 441 cities (or urban agglomerations) for analysis. At the 1 km resolution, some local climate zone types would yield insufficient samples for constructing cooling efficiency models. Therefore, instead of identifying local climate zone explicitly, we took an indirect approach to account for local climate confounding factors, that is, we constructed a multiple regression model for a whole city incorporating the hottest-month local temperature 95 , precipitation 96 , and humidity (based on NASA FLDAS dataset 99 ), albedo (derived from the MODIS MCD43A3 product 100 ), aerosol loading (derived from the MODIS MCD19A2 product 101 ), wind speed (based on TerraClimate dataset 96 ), topography elevation 90 , distance to water 91 , urban morphology (building height 102 ), and human activity intensity (VIIRS nighttime light data as a proxy indicator 103 ). We used the absolute value of the linear regression coefficient of NDVI as the cooling efficiency of the whole city (model: LST ~ NDVI + temperature + precipitation + humidity + distance to water + topography + building height + albedo + aerosol + wind speed + nighttime light), and calculated cooling capacity and cooling benefit based on the same method. Variable selection was conducted using the criterion of VIF < 5.
Our results indicated that MODIS-based cooling capacity and cooling benefit are significantly correlated with the Landsat-based counterparts (Supplementary Fig. 16 ); importantly, the gap between the Global South and North cities is around two-fold, close to the result from the Landsat-based result (Supplementary Fig. 17 ).
(3) For the calculation of cooling benefit, we considered different spatial scales of human accessibility to green spaces: assuming the population in each 100 × 100 m 2 grid cell could access to green spaces within neighborhoods of certain extents, we calculated cooling benefit by replacing NDVI i in Eq. ( 3 ) with mean NDVI within the 300 × 300 m 2 and 500 × 500 m 2 extents centered at the focal grid cell (Supplementary Fig. 18 ).
(4) Considering cities may vary in minimum NDVI, we assessed if this variation could affect resulting cooling capacity patterns. To this end, we calculated the cooling capacity for each studied city using NDVI = 0 as the reference (i.e., using NDVI = 0 instead of minimum NDVI in Supplementary Fig. 13b ), and correlated it with that using minimum NDVI as the reference (Supplementary Fig. 19 ).
Quantifying between-city inequality
Inequalities in access to the benefits of green spaces in cities exist within cities, as is increasingly well-documented 104 . Here, we focus instead on the inequalities among cities. We used the Gini coefficient to measure the inequality in cooling capacity and cooling benefit between all studied cities across the globe as well as between Global North or South cities. We calculated Gini using the population-density weighted method (Fig. 5b ), as well as the unweighted and population-size weighted methods (Supplementary Fig. 20 ).
Estimating the potential for more effective and equal cooling amelioration
We estimated the potential of enhancing cooling amelioration based on the assumptions that urban green space quality (cooling efficiency) and quantity (NDVI) can be increased to different levels, and that relative spatial distributions of green spaces and population can be idealized (so that their spatial matches can maximize cooling benefit). We assumed that macro-climate conditions act as the constraints of vegetation cover and cooling efficiency. We calculated the 50th, 60th, 70th, 80th, and 90th percentiles of NDVI within each type of local climate zone of each city. For a given local climate zone type, we obtained the city with the highest NDVI per percentile value as the regional upper bounds of urban green infrastructure quantity. The regional upper bounds of cooling efficiency are derived in a similar way. For each local climate zone in a city, we generated a potential NDVI distribution where all grid cells reach the regional upper bound values for the 50th, 60th, 70th, 80th, or 90th percentile of urban green space quantity or quality, respectively. NDVI values below these percentiles were increased, whereas those above these percentiles remained unchanged. The potential estimates are essentially dependent on the references, i.e., the optimal cooling efficiency and NDVI that a given city can reach. However, such references are obviously difficult to determine, because complex natural and socioeconomic conditions could play important roles in determining those cooling optima, and the dominant factors are unknown at a global scale. We employed the simplifying assumption that background climate could act as an essential constraint according to our results. We therefore used the Köppen climate classification system 105 to determine the reference separately in each climate region (tropical, arid, temperate, and continental climate regions were involved for all studied cities).
We calculated potential cooling capacity and cooling benefit based on these potential NDVI maps (Fixed cooling efficiency in Fig. 5 ). We then calculated the potentials if cooling efficiency of each city can be enhanced to 50–90th percentile across all urban local climate zones within the corresponding biogeographic region (Fixed green space area in Fig. 5 ). We also calculated the potentials if both NDVI and cooling efficiency were enhanced (Enhancing both in Fig. 5) to a certain corresponding level (i.e., i th percentile NDVI + i th percentile cooling efficiency). We examined if there are additional effects of idealizing relative spatial distributions of urban green spaces and humans on cooling benefits. To this end, the pixel values of NDVI or population amount remained unchanged, but their one-to-one correspondences were based on their ranking: the largest population corresponds to the highest NDVI, and so forth. Under each scenario, we calculated cooling capacity and cooling benefit for each city, and the between-city inequality was measured by the Gini coefficient.
We used the Google Earth Engine to process the spatial data. The statistical analyses were conducted using R v4.3.3 106 , with car v3.1-2 107 , piecewiseSEM v2.1.2 108 , and ineq v0.2-13 109 packages. The global maps of cooling were created using the ArcGIS v10.3 software.
Reporting summary
Further information on research design is available in the Nature Portfolio Reporting Summary linked to this article.
Data availability
City population statistics data is collected from the Population Division of the Department of Economic and Social Affairs of the United Nations ( https://www.un.org/development/desa/pd/content/worlds-cities-2018-data-booklet ). Global North-South division is based on Human Development Report 2019 which from United Nations Development Programme ( https://hdr.undp.org/content/human-development-report-2019 ). Global urban boundaries from GAIA data are available from Star Cloud Data Service Platform ( https://data-starcloud.pcl.ac.cn/resource/14 ) . Global water data is derived from 2018 Copernicus Global Land Service (CGLS 100-m) data ( https://developers.google.com/earth-engine/datasets/catalog/COPERNICUS_Landcover_100m_Proba-V-C3_Global ), European Space Agency (ESA) WorldCover 10 m 2020 product ( https://developers.google.com/earth-engine/datasets/catalog/ESA_WorldCover_v100 ), and GSHHG (A Global Self-consistent, Hierarchical, High-resolution Geography Database) at https://www.soest.hawaii.edu/pwessel/gshhg/ . Landsat 8 LST and NDVI data with 30 m resolution are available at https://developers.google.com/earth-engine/datasets/catalog/LANDSAT_LC08_C02_T1_L2 . Land surface temperature (LST) data with 1 km from MODIS Aqua product (MYD11A1) is available at https://developers.google.com/earth-engine/datasets/catalog/MODIS_061_MYD11A1 . NDVI (1 km) dataset from MYD13A2 is available at https://developers.google.com/earth-engine/datasets/catalog/MODIS_061_MYD13A2 . Population data (100 m) is derived from WorldPop ( https://developers.google.com/earth-engine/datasets/catalog/WorldPop_GP_100m_pop ). Local climate zones are also based on 2018 CGLS data ( https://developers.google.com/earth-engine/datasets/catalog/COPERNICUS_Landcover_100m_Proba-V-C3_Global ), and built-up height data is available from Global Human Settlement Layers (GHSL, 100 m) ( https://developers.google.com/earth-engine/datasets/catalog/JRC_GHSL_P2023A_GHS_BUILT_H ). Temperature data is calculated from ERA5-Land Monthly Aggregated dataset ( https://developers.google.com/earth-engine/datasets/catalog/ECMWF_ERA5_LAND_MONTHLY_AGGR ). Precipitation and wind data are calculated from TerraClimate (Monthly Climate and Climatic Water Balance for Global Terrestrial Surfaces, University of Idaho) ( https://developers.google.com/earth-engine/datasets/catalog/IDAHO_EPSCOR_TERRACLIMATE ). Humidity data is calculated from Famine Early Warning Systems Network (FEWS NET) Land Data Assimilation System ( https://developers.google.com/earth-engine/datasets/catalog/NASA_FLDAS_NOAH01_C_GL_M_V001 ). Topography data from MERIT DEM (Multi-Error-Removed Improved-Terrain DEM) product is available at https://developers.google.com/earth-engine/datasets/catalog/MERIT_DEM_v1_0_3 . GDP from Gross Domestic Product and Human Development Index dataset is available at https://doi.org/10.5061/dryad.dk1j0 . VIIRS nighttime light data is available at https://developers.google.com/earth-engine/datasets/catalog/NOAA_VIIRS_DNB_MONTHLY_V1_VCMSLCFG . City building volume data from Global 3D Building Structure (1 km) is available at https://doi.org/10.34894/4QAGYL . Albedo data is derived from the MODIS MCD43A3 product ( https://developers.google.com/earth-engine/datasets/catalog/MODIS_061_MCD43A3 ), and aerosol data is derived from the MODIS MCD19A2 product ( https://developers.google.com/earth-engine/datasets/catalog/MODIS_061_MCD19A2_GRANULES ). All data used for generating the results are publicly available at https://doi.org/10.6084/m9.figshare.26340592.v1 .
Code availability
The codes used for data collection and analyses are publicly available at https://doi.org/10.6084/m9.figshare.26340592.v1 .
Dosio, A., Mentaschi, L., Fischer, E. M. & Wyser, K. Extreme heat waves under 1.5 °C and 2 °C global warming. Environ. Res. Lett. 13 , 054006 (2018).
Article ADS Google Scholar
Suarez-Gutierrez, L., Müller, W. A., Li, C. & Marotzke, J. Hotspots of extreme heat under global warming. Clim. Dyn. 55 , 429–447 (2020).
Article Google Scholar
Guo, Y. et al. Global variation in the effects of ambient temperature on mortality: a systematic evaluation. Epidemiology 25 , 781–789 (2014).
Article PubMed PubMed Central Google Scholar
Mora, C. et al. Global risk of deadly heat. Nat. Clim. Chang. 7 , 501–506 (2017).
Ebi, K. L. et al. Hot weather and heat extremes: health risks. Lancet 398 , 698–708 (2021).
Article PubMed Google Scholar
Lüthi, S. et al. Rapid increase in the risk of heat-related mortality. Nat. Commun. 14 , 4894 (2023).
Article ADS PubMed PubMed Central Google Scholar
United Nations Department of Economic Social Affairs, Population Division. in World Population Prospects 2022: Summary of Results (United Nations Fund for Population Activities, 2022).
Sachindra, D., Ng, A., Muthukumaran, S. & Perera, B. Impact of climate change on urban heat island effect and extreme temperatures: a case‐study. Q. J. R. Meteorol. Soc. 142 , 172–186 (2016).
Guo, L. et al. Evaluating contributions of urbanization and global climate change to urban land surface temperature change: a case study in Lagos, Nigeria. Sci. Rep. 12 , 14168 (2022).
Article ADS CAS PubMed PubMed Central Google Scholar
Liu, Z. et al. Surface warming in global cities is substantially more rapid than in rural background areas. Commun. Earth Environ. 3 , 219 (2022).
Mentaschi, L. et al. Global long-term mapping of surface temperature shows intensified intra-city urban heat island extremes. Glob. Environ. Change 72 , 102441 (2022).
Asseng, S., Spänkuch, D., Hernandez-Ochoa, I. M. & Laporta, J. The upper temperature thresholds of life. Lancet Planet. Health 5 , e378–e385 (2021).
Zander, K. K., Botzen, W. J., Oppermann, E., Kjellstrom, T. & Garnett, S. T. Heat stress causes substantial labour productivity loss in Australia. Nat. Clim. Chang. 5 , 647–651 (2015).
Flouris, A. D. et al. Workers’ health and productivity under occupational heat strain: a systematic review and meta-analysis. Lancet Planet. Health 2 , e521–e531 (2018).
Xu, C., Kohler, T. A., Lenton, T. M., Svenning, J.-C. & Scheffer, M. Future of the human climate niche. Proc. Natl Acad. Sci. USA 117 , 11350–11355 (2020).
Lenton, T. M. et al. Quantifying the human cost of global warming. Nat. Sustain. 6 , 1237–1247 (2023).
Harrington, L. J. et al. Poorest countries experience earlier anthropogenic emergence of daily temperature extremes. Environ. Res. Lett. 11 , 055007 (2016).
Bathiany, S., Dakos, V., Scheffer, M. & Lenton, T. M. Climate models predict increasing temperature variability in poor countries. Sci. Adv. 4 , eaar5809 (2018).
Alizadeh, M. R. et al. Increasing heat‐stress inequality in a warming climate. Earth Future 10 , e2021EF002488 (2022).
Tuholske, C. et al. Global urban population exposure to extreme heat. Proc. Natl Acad. Sci. USA 118 , e2024792118 (2021).
Article CAS PubMed PubMed Central Google Scholar
Manoli, G. et al. Magnitude of urban heat islands largely explained by climate and population. Nature 573 , 55–60 (2019).
Article ADS CAS PubMed Google Scholar
Wang, J. et al. Anthropogenic emissions and urbanization increase risk of compound hot extremes in cities. Nat. Clim. Chang. 11 , 1084–1089 (2021).
Article ADS CAS Google Scholar
Bowler, D. E., Buyung-Ali, L., Knight, T. M. & Pullin, A. S. Urban greening to cool towns and cities: a systematic review of the empirical evidence. Landsc. Urban Plan. 97 , 147–155 (2010).
Armson, D., Stringer, P. & Ennos, A. The effect of tree shade and grass on surface and globe temperatures in an urban area. Urban For. Urban Green. 11 , 245–255 (2012).
Wang, C., Wang, Z. H. & Yang, J. Cooling effect of urban trees on the built environment of contiguous United States. Earth Future 6 , 1066–1081 (2018).
Pataki, D. E., McCarthy, H. R., Litvak, E. & Pincetl, S. Transpiration of urban forests in the Los Angeles metropolitan area. Ecol. Appl. 21 , 661–677 (2011).
Konarska, J. et al. Transpiration of urban trees and its cooling effect in a high latitude city. Int. J. Biometeorol. 60 , 159–172 (2016).
Article ADS PubMed Google Scholar
Li, X., Zhou, W., Ouyang, Z., Xu, W. & Zheng, H. Spatial pattern of greenspace affects land surface temperature: evidence from the heavily urbanized Beijing metropolitan area, China. Landsc. Ecol. 27 , 887–898 (2012).
Yu, Z., Xu, S., Zhang, Y., Jørgensen, G. & Vejre, H. Strong contributions of local background climate to the cooling effect of urban green vegetation. Sci. Rep. 8 , 6798 (2018).
Richards, D. R., Fung, T. K., Belcher, R. & Edwards, P. J. Differential air temperature cooling performance of urban vegetation types in the tropics. Urban For. Urban Green. 50 , 126651 (2020).
Winbourne, J. B. et al. Tree transpiration and urban temperatures: current understanding, implications, and future research directions. BioScience 70 , 576–588 (2020).
Schwaab, J. et al. The role of urban trees in reducing land surface temperatures in European cities. Nat. Commun. 12 , 6763 (2021).
Vo, T. T. & Hu, L. Diurnal evolution of urban tree temperature at a city scale. Sci. Rep. 11 , 10491 (2021).
Wang, J. et al. Comparing relationships between urban heat exposure, ecological structure, and socio-economic patterns in Beijing and New York City. Landsc. Urban Plan. 235 , 104750 (2023).
Chen, B. et al. Contrasting inequality in human exposure to greenspace between cities of Global North and Global South. Nat. Commun. 13 , 4636 (2022).
Pavanello, F. et al. Air-conditioning and the adaptation cooling deficit in emerging economies. Nat. Commun. 12 , 6460 (2021).
Turner, V. K., Middel, A. & Vanos, J. K. Shade is an essential solution for hotter cities. Nature 619 , 694–697 (2023).
Hope, D. et al. Socioeconomics drive urban plant diversity. Proc. Natl Acad. Sci. USA 100 , 8788–8792 (2003).
Leong, M., Dunn, R. R. & Trautwein, M. D. Biodiversity and socioeconomics in the city: a review of the luxury effect. Biol. Lett. 14 , 20180082 (2018).
Schwarz, K. et al. Trees grow on money: urban tree canopy cover and environmental justice. PloS ONE 10 , e0122051 (2015).
Chakraborty, T., Hsu, A., Manya, D. & Sheriff, G. Disproportionately higher exposure to urban heat in lower-income neighborhoods: a multi-city perspective. Environ. Res. Lett. 14 , 105003 (2019).
Wang, J. et al. Significant effects of ecological context on urban trees’ cooling efficiency. ISPRS J. Photogramm. Remote Sens. 159 , 78–89 (2020).
Marando, F. et al. Urban heat island mitigation by green infrastructure in European Functional Urban Areas. Sust. Cities Soc. 77 , 103564 (2022).
Cheng, X., Peng, J., Dong, J., Liu, Y. & Wang, Y. Non-linear effects of meteorological variables on cooling efficiency of African urban trees. Environ. Int. 169 , 107489 (2022).
Yang, Q. et al. Global assessment of urban trees’ cooling efficiency based on satellite observations. Environ. Res. Lett. 17 , 034029 (2022).
Yin, Y., He, L., Wennberg, P. O. & Frankenberg, C. Unequal exposure to heatwaves in Los Angeles: Impact of uneven green spaces. Sci. Adv. 9 , eade8501 (2023).
Fantom N., Serajuddin U. The World Bank’s Classification of Countries by Income (The World Bank, 2016).
Iungman, T. et al. Cooling cities through urban green infrastructure: a health impact assessment of European cities. Lancet 401 , 577–589 (2023).
He, C. et al. The inequality labor loss risk from future urban warming and adaptation strategies. Nat. Commun. 13 , 3847 (2022).
Kii, M. Projecting future populations of urban agglomerations around the world and through the 21st century. npj Urban Sustain 1 , 10 (2021).
Paschalis, A., Chakraborty, T., Fatichi, S., Meili, N. & Manoli, G. Urban forests as main regulator of the evaporative cooling effect in cities. AGU Adv. 2 , e2020AV000303 (2021).
Hunte, N., Roopsind, A., Ansari, A. A. & Caughlin, T. T. Colonial history impacts urban tree species distribution in a tropical city. Urban For. Urban Green. 41 , 313–322 (2019).
Kabano, P., Harris, A. & Lindley, S. Sensitivity of canopy phenology to local urban environmental characteristics in a tropical city. Ecosystems 24 , 1110–1124 (2021).
Frank, S. D. & Backe, K. M. Effects of urban heat islands on temperate forest trees and arthropods. Curr. Rep. 9 , 48–57 (2023).
Esperon-Rodriguez, M. et al. Climate change increases global risk to urban forests. Nat. Clim. Chang. 12 , 950–955 (2022).
Stewart, I. D. & Oke, T. R. Local climate zones for urban temperature studies. Bull. Am. Meteorol. Soc. 93 , 1879–1900 (2012).
Biardeau, L. T., Davis, L. W., Gertler, P. & Wolfram, C. Heat exposure and global air conditioning. Nat. Sustain. 3 , 25–28 (2020).
Davis, L., Gertler, P., Jarvis, S. & Wolfram, C. Air conditioning and global inequality. Glob. Environ. Change 69 , 102299 (2021).
Colelli, F. P., Wing, I. S. & Cian, E. D. Air-conditioning adoption and electricity demand highlight climate change mitigation–adaptation tradeoffs. Sci. Rep. 13 , 4413 (2023).
Sun, L., Chen, J., Li, Q. & Huang, D. Dramatic uneven urbanization of large cities throughout the world in recent decades. Nat. Commun. 11 , 5366 (2020).
Liu, D., Kwan, M.-P. & Kan, Z. Analysis of urban green space accessibility and distribution inequity in the City of Chicago. Urban For. Urban Green. 59 , 127029 (2021).
Hsu, A., Sheriff, G., Chakraborty, T. & Manya, D. Disproportionate exposure to urban heat island intensity across major US cities. Nat. Commun. 12 , 2721 (2021).
Zhao, L., Lee, X., Smith, R. B. & Oleson, K. Strong contributions of local background climate to urban heat islands. Nature 511 , 216–219 (2014).
Wu, S., Chen, B., Webster, C., Xu, B. & Gong, P. Improved human greenspace exposure equality during 21st century urbanization. Nat. Commun. 14 , 6460 (2023).
Zhao, J., Zhao, X., Wu, D., Meili, N. & Fatichi, S. Satellite-based evidence highlights a considerable increase of urban tree cooling benefits from 2000 to 2015. Glob. Chang. Biol. 29 , 3085–3097 (2023).
Article CAS PubMed Google Scholar
Nice, K. A., Coutts, A. M. & Tapper, N. J. Development of the VTUF-3D v1. 0 urban micro-climate model to support assessment of urban vegetation influences on human thermal comfort. Urban Clim. 24 , 1052–1076 (2018).
Meili, N. et al. An urban ecohydrological model to quantify the effect of vegetation on urban climate and hydrology (UT&C v1. 0). Geosci. Model Dev. 13 , 335–362 (2020).
Nesbitt, L., Meitner, M. J., Sheppard, S. R. & Girling, C. The dimensions of urban green equity: a framework for analysis. Urban For. Urban Green. 34 , 240–248 (2018).
Hedblom, M., Prévot, A.-C. & Grégoire, A. Science fiction blockbuster movies—a problem or a path to urban greenery? Urban For. Urban Green. 74 , 127661 (2022).
Norton, B. A. et al. Planning for cooler cities: a framework to prioritise green infrastructure to mitigate high temperatures in urban landscapes. Landsc. Urban Plan 134 , 127–138 (2015).
Medl, A., Stangl, R. & Florineth, F. Vertical greening systems—a review on recent technologies and research advancement. Build. Environ. 125 , 227–239 (2017).
Chen, B., Lin, C., Gong, P. & An, J. Optimize urban shade using digital twins of cities. Nature 622 , 242–242 (2023).
Pamukcu-Albers, P. et al. Building green infrastructure to enhance urban resilience to climate change and pandemics. Landsc. Ecol. 36 , 665–673 (2021).
Haaland, C. & van Den Bosch, C. K. Challenges and strategies for urban green-space planning in cities undergoing densification: a review. Urban For. Urban Green. 14 , 760–771 (2015).
Shafique, M., Kim, R. & Rafiq, M. Green roof benefits, opportunities and challenges—a review. Renew. Sust. Energ. Rev. 90 , 757–773 (2018).
Wang, J., Zhou, W. & Jiao, M. Location matters: planting urban trees in the right places improves cooling. Front. Ecol. Environ. 20 , 147–151 (2022).
Lan, T., Liu, Y., Huang, G., Corcoran, J. & Peng, J. Urban green space and cooling services: opposing changes of integrated accessibility and social equity along with urbanization. Sust. Cities Soc. 84 , 104005 (2022).
Wood, S. & Dupras, J. Increasing functional diversity of the urban canopy for climate resilience: Potential tradeoffs with ecosystem services? Urban For. Urban Green. 58 , 126972 (2021).
Wong, N. H., Tan, C. L., Kolokotsa, D. D. & Takebayashi, H. Greenery as a mitigation and adaptation strategy to urban heat. Nat. Rev. Earth Environ. 2 , 166–181 (2021).
United Nations. Department of economic and social affairs, population division. in The World’s Cities in 2018—Data Booklet (UN, 2018).
United Nations Development Programme (UNDP). Human Development Report 2019: Beyond Income, Beyond Averages, Beyond Today: Inequalities in Human Development in the 21st Century (United Nations Development Programme (UNDP), 2019)
Li, X. et al. Mapping global urban boundaries from the global artificial impervious area (GAIA) data. Environ. Res. Lett. 15 , 094044 (2020).
Stevens, F. R., Gaughan, A. E., Linard, C. & Tatem, A. J. Disaggregating census data for population mapping using random forests with remotely-sensed and ancillary data. PloS ONE 10 , e0107042 (2015).
Buchhorn, M. et al. Copernicus global land cover layers—collection 2. Remote Sens 12 , 1044 (2020).
Gillerot, L. et al. Forest structure and composition alleviate human thermal stress. Glob. Change Biol. 28 , 7340–7352 (2022).
Article CAS Google Scholar
Hamada, S., Tanaka, T. & Ohta, T. Impacts of land use and topography on the cooling effect of green areas on surrounding urban areas. Urban For. Urban Green. 12 , 426–434 (2013).
Sun, X. et al. Quantifying landscape-metrics impacts on urban green-spaces and water-bodies cooling effect: the study of Nanjing, China. Urban For . Urban Green. 55 , 126838 (2020).
Zhang, Q., Zhou, D., Xu, D. & Rogora, A. Correlation between cooling effect of green space and surrounding urban spatial form: Evidence from 36 urban green spaces. Build. Environ. 222 , 109375 (2022).
Pesaresi, M., Politis, P. GHS-BUILT-H R2023A - GHS building height, derived from AW3D30, SRTM30, and Sentinel2 composite (2018) . European Commission, Joint Research Centre (JRC) https://doi.org/10.2905/85005901-3A49-48DD-9D19-6261354F56FE (2023).
Yamazaki, D. et al. A high‐accuracy map of global terrain elevations. Geophys. Res. Lett. 44 , 5844–5853 (2017).
Wessel, P. & Smith, W. H. A global, self‐consistent, hierarchical, high‐resolution shoreline database. J. Geophys. Res. Solid Earth 101 , 8741–8743 (1996).
Ren et al. climatic map studies: a review. Int. J. Climatol. 31 , 2213–2233 (2011).
Zhou, X. et al. Evaluation of urban heat islands using local climate zones and the influence of sea-land breeze. Sust. Cities Soc. 55 , 102060 (2020).
Zhou, W., Huang, G. & Cadenasso, M. L. Does spatial configuration matter? Understanding the effects of land cover pattern on land surface temperature in urban landscapes. Landsc. Urban Plan 102 , 54–63 (2011).
Muñoz Sabater, J. ERA5-Land monthly averaged data from 1981 to present . Copernicus Climate Change Service (C3S) Climate Data Store (CDS) https://doi.org/10.24381/cds.68d2bb30 (2019).
Abatzoglou, J. T., Dobrowski, S. Z., Parks, S. A. & Hegewisch, K. C. TerraClimate, a high-resolution global dataset of monthly climate and climatic water balance from 1958–2015. Sci. Data 5 , 1–12 (2018).
Kummu, M., Taka, M. & Guillaume, J. H. Gridded global datasets for gross domestic product and Human Development Index over 1990–2015. Sci. Data 5 , 1–15 (2018).
Zanaga, D. et al. ESA WorldCover 10 m 2020 v100. https://doi.org/10.5281/zenodo.5571936 (2021).
McNally, A. et al. A land data assimilation system for sub-Saharan Africa food and water security applications. Sci. Data 4 , 1–19 (2017).
Schaaf C., & Wang Z. MODIS/Terra+Aqua BRDF/Albedo Daily L3 Global - 500m V061 . NASA EOSDIS Land Processes Distributed Active Archive Center. https://doi.org/10.5067/MODIS/MCD43A3.061 (2021).
Lyapustin A., & Wang Y. MODIS/Terra+Aqua Land Aerosol Optical Depth Daily L2G Global 1km SIN Grid V061 . NASA EOSDIS Land Processes Distributed Active Archive Center. https://doi.org/10.5067/MODIS/MCD19A2.061 (2022).
Li, M., Wang, Y., Rosier, J. F., Verburg, P. H. & Vliet, J. V. Global maps of 3D built-up patterns for urban morphological analysis. Int. J. Appl. Earth Obs. Geoinf. 114 , 103048 (2022).
Google Scholar
Elvidge, C. D., Baugh, K., Zhizhin, M., Hsu, F. C. & Ghosh, T. VIIRS night-time lights. Int. J. Remote Sens. 38 , 5860–5879 (2017).
Zhou, W. et al. Urban tree canopy has greater cooling effects in socially vulnerable communities in the US. One Earth 4 , 1764–1775 (2021).
Beck, H. E. et al. Present and future Köppen-Geiger climate classification maps at 1-km resolution. Sci. Data 5 , 1–12 (2018).
R. Core Team. R: A Language and Environment for Statistical Computing . R Foundation for Statistical Computing, Vienna, Austria. https://www.R-project.org/ (2023).
Fox J., & Weisberg S. An R Companion to Applied Regression 3rd edn (Sage, 2019). https://socialsciences.mcmaster.ca/jfox/Books/Companion/ .
Lefcheck, J. S. piecewiseSEM: Piecewise structural equation modelling in r for ecology, evolution, and systematics. Methods Ecol. Evol. 7 , 573–579 (2016).
Zeileis, A. _ineq: Measuring Inequality, Concentration, and Poverty_ . R package version 0.2-13. https://CRAN.R-project.org/package=ineq (2014).
Download references
Acknowledgements
We thank all the data providers. We thank Marten Scheffer for valuable discussion. C.X. is supported by the National Natural Science Foundation of China (Grant No. 32061143014). J.-C.S. was supported by Center for Ecological Dynamics in a Novel Biosphere (ECONOVO), funded by Danish National Research Foundation (grant DNRF173), and his VILLUM Investigator project “Biodiversity Dynamics in a Changing World”, funded by VILLUM FONDEN (grant 16549). W.Z. was supported by the National Science Foundation of China through Grant No. 42225104. T.M.L. and J.F.A. are supported by the Open Society Foundations (OR2021-82956). W.J.R. is supported by the funding received from Roger Worthington.
Author information
Authors and affiliations.
School of Life Sciences, Nanjing University, Nanjing, China
Yuxiang Li, Shuqing N. Teng & Chi Xu
Center for Ecological Dynamics in a Novel Biosphere (ECONOVO), Department of Biology, Aarhus University, Aarhus, Denmark
Jens-Christian Svenning
State Key Laboratory of Urban and Regional Ecology, Research Center for Eco-Environmental Sciences, Chinese Academy of Sciences, Beijing, China
University of Chinese Academy of Sciences, Beijing, China
Beijing Urban Ecosystem Research Station, Research Center for Eco-Environmental Sciences, Chinese Academy of Sciences, Beijing, China
School for Environment and Sustainability, University of Michigan, Ann Arbor, MI, USA
Global Systems Institute, University of Exeter, Exeter, UK
Jesse F. Abrams & Timothy M. Lenton
Department of Forest Ecosystems and Society, Oregon State University, Corvallis, OR, USA
William J. Ripple
Department of Environmental Science and Engineering, Fudan University, Shanghai, China
Department of Applied Ecology, North Carolina State University, Raleigh, NC, USA
Robert R. Dunn
You can also search for this author in PubMed Google Scholar
Contributions
Y.L., S.N.T., R.R.D., and C.X. designed the study. Y.L. collected the data, generated the code, performed the analyses, and produced the figures with inputs from J.-C.S., W.Z., K.Z., J.F.A., T.M.L., W.J.R., Z.Y., S.N.T., R.R.D. and C.X. Y.L., S.N.T., R.R.D. and C.X. wrote the first draft with inputs from J.-C.S., W.Z., K.Z., J.F.A., T.M.L., W.J.R., and Z.Y. All coauthors interpreted the results and revised the manuscript.
Corresponding authors
Correspondence to Shuqing N. Teng , Robert R. Dunn or Chi Xu .
Ethics declarations
Competing interests.
The authors declare no competing interests.
Peer review
Peer review information.
Nature Communications thanks Chris Webster and the other, anonymous, reviewer(s) for their contribution to the peer review of this work. A peer review file is available.
Additional information
Publisher’s note Springer Nature remains neutral with regard to jurisdictional claims in published maps and institutional affiliations.
Supplementary information
Supplementary information, peer review file, description of additional supplementary files, supplementary data 1, reporting summary, rights and permissions.
Open Access This article is licensed under a Creative Commons Attribution-NonCommercial-NoDerivatives 4.0 International License, which permits any non-commercial use, sharing, distribution and reproduction in any medium or format, as long as you give appropriate credit to the original author(s) and the source, provide a link to the Creative Commons licence, and indicate if you modified the licensed material. You do not have permission under this licence to share adapted material derived from this article or parts of it. The images or other third party material in this article are included in the article’s Creative Commons licence, unless indicated otherwise in a credit line to the material. If material is not included in the article’s Creative Commons licence and your intended use is not permitted by statutory regulation or exceeds the permitted use, you will need to obtain permission directly from the copyright holder. To view a copy of this licence, visit http://creativecommons.org/licenses/by-nc-nd/4.0/ .
Reprints and permissions
About this article
Cite this article.
Li, Y., Svenning, JC., Zhou, W. et al. Green spaces provide substantial but unequal urban cooling globally. Nat Commun 15 , 7108 (2024). https://doi.org/10.1038/s41467-024-51355-0
Download citation
Received : 06 December 2023
Accepted : 05 August 2024
Published : 02 September 2024
DOI : https://doi.org/10.1038/s41467-024-51355-0
Share this article
Anyone you share the following link with will be able to read this content:
Sorry, a shareable link is not currently available for this article.
Provided by the Springer Nature SharedIt content-sharing initiative
By submitting a comment you agree to abide by our Terms and Community Guidelines . If you find something abusive or that does not comply with our terms or guidelines please flag it as inappropriate.
Quick links
- Explore articles by subject
- Guide to authors
- Editorial policies
Sign up for the Nature Briefing newsletter — what matters in science, free to your inbox daily.


7.5 Case Study: The Aral Sea – Going, Going, Gone

The Aral Sea is a lake located east of the Caspian Sea between Uzbekistan and Kazakhstan in central Asia. This area is part of the Turkestan desert, which is the fourth largest desert in the world; it is produced from a rain shadow effect by Afghanistan’s high mountains to the south. Due to the arid and seasonally hot climate there is extensive evaporation and limited surface waters in general. Summer temperatures can reach 60 ο C (140 ο F)! The water supply to the Aral Sea is mainly from two rivers, the Amu Darya and Syr Darya, which carry snow melt from mountainous areas. In the early 1960s, the then-Soviet Union diverted the Amu Darya and Syr Darya Rivers for irrigation of one of the driest parts of Asia to produce rice, melons, cereals, and especially cotton. The Soviets wanted cotton or white gold to become a major export. They were successful, and, today Uzbekistan is one of the world’s largest exporters of cotton. Unfortunately, this action essentially eliminated any river inflow to the Aral Sea and caused it to disappear almost completely.

In 1960, Aral Sea was the fourth largest inland water body; only the Caspian Sea, Lake Superior, and Lake Victoria were larger. Since then, it has progressively shrunk due to evaporation and lack of recharge by rivers. Before 1965, the Aral Sea received 2060 km 3 of fresh water per year from rivers and by the early 1980s it received none. By 2007, the Aral Sea shrank to about 10% of its original size and its salinity increased from about 1% dissolved salt to about 10% dissolved salt, which is 3 times more saline than seawater. These changes caused an enormous environmental impact. A once thriving fishing industry is dead as are the 24 species of fish that used to live there; the fish could not adapt to the more saline waters. The current shoreline is tens of kilometers from former fishing towns and commercial ports. Large shing boats lie in the dried up lakebed of dust and salt. A frustrating part of the river diversion project is that many of the irrigation canals were poorly built, allowing abundant water to leak or evaporate. An increasing number of dust storms blow salt, pesticides, and herbicides into nearby towns causing a variety of respiratory illnesses including tuberculosis.

The wetlands of the two river deltas and their associated ecosystems have disappeared. The regional climate is drier and has greater temperature extremes due to the absence of moisture and moderating influence from the lake. In 2003, some lake restoration work began on the northern part of the Aral Sea and it provided some relief by raising water levels and reducing salinity somewhat. The southern part of the Aral Sea has seen no relief and remains nearly completely dry. The destruction of the Aral Sea is one of the planet’s biggest environmental disasters and it is caused entirely by humans. Lake Chad in Africa is another example of a massive lake that has nearly disappeared for the same reasons as the Aral Sea. Aral Sea and Lake Chad are the most extreme examples of large lakes destroyed by unsustainable diversions of river water. Other lakes that have shrunk significantly due to human diversions of water include the Dead Sea in the Middle East, Lake Manchar in Pakistan, and Owens Lake and Mono Lake, both in California.
Attribution
Essentials of Environmental Science by Kamala Doršner is licensed under CC BY 4.0 . Modified from the original by Matthew R. Fisher.
Environmental Biology Copyright © 2017 by Matthew R. Fisher is licensed under a Creative Commons Attribution 4.0 International License , except where otherwise noted.
Share This Book
- Resources Home
- All Publications
- Digital Resources
- The BERA Podcast
- Research Intelligence
- BERA Journals
- Ethics and guidance
- BERA Blog Home
- About the blog
- Blog special issues
- Blog series
- Submission policy
- Opportunities Home
- Awards and Funding
- Communities Home
- Special Interest Groups
- Early Career Researcher Network
- Events Home
- BERA Conference 2024
- Upcoming Events
- Past Events
- Past Conferences
- BERA Membership
Resources for research Part of series: Research Ethics Case Studies 2024
Research Ethics Case Studies 2024: Frontlines of climate change education

This case study considers some of the ethical issues related to sustainability and environmental responsibility in relation to educational research. It highlights how environmental implications should be considered at all stages of research, and efforts made to reduce any negative impacts and address existing environmental injustices.
Leila’s PhD study aims to understand young people’s imagined futures and identify how education can create pathways to more just and sustainable future societies. She has designed a multi-site case study, working with teachers and young people in England and Pakistan to conduct workshops that give young people the opportunity to imagine their futures in a range of different emissions scenarios. Leila is concerned about the risk of psychological pain and distress associated with climate anxiety during her data collection phase, and a colleague queries the environmental impacts of her study given her plans for overseas travel. How can she find a way forward to do her research ethically?
Drawing on BERA’s Ethical Guidelines for Educational Research , this case study discusses key ethical issues, including:
- researchers’ duty of care towards participants and responsibilities to identify and minimise any potential harm arising from their participation in research
- researchers’ responsibilities to the global community and the environment more generally
- applying ethical principles in different social, cultural and political contexts
- authorship of data and publications.
About this series
BERA’s Research Ethics Case Studies , edited by Sin Wang Chong and Alison Fox, complement BERA’s Ethical Guidelines for Educational Research , fifth edition (2024) by giving concrete examples of how those guidelines can be applied during the research process.
Annotations in the margins of each case study document indicate where, among the numbered paragraphs of BERA’s Ethical Guidelines , readers can find full advice on the issues raised. The annotations include hyperlinks to the relevant passages of the guidelines.
For a full account of ethical best practice as recommended by BERA, researchers should refer to our Ethical Guidelines , which these case studies are intended to illustrate without themselves offering guidance or recommendations.

Senior Lecturer in Science Education at University of York
Lynda Dunlop is Director of Education for Environmental Sustainability at York, and a senior lecturer in science education. Her research is interdisciplinary, working across the social sciences, sciences and arts and humanities. Current studies...

Head of Education Division at University of Stirling
Professor Elizabeth Rushton is a professor in Education and the head of the Division of Education, Faculty of Social Sciences at the University of Stirling. Her research interests are in geography and science education, specifically the...
More related content
Publication series
Resources for research 10 Apr 2024
Publishing opportunity Closed
BERA in the news 6 Sep 2024
News 30 Aug 2024
News 12 Aug 2024
News 2 Aug 2024
Assessing land use land cover change using remote sensing and GIS techniques: A case study of Kashmir Valley
- Published: 31 August 2024
- Volume 133 , article number 168 , ( 2024 )
Cite this article

- Injila Hamid ORCID: orcid.org/0000-0001-6763-572X 1 , 3 ,
- Lateef Ahmad Dar 2 &
- Bertug Akintug 3
Land use land cover (LULC) changes hugely influence the ecological balance of an ecosystem, which adversely affects the inhabitants, making them more vulnerable to natural calamities. The LULC change studies are therefore carried out to analyze the impact of these changes on the overall ecology of an area and are very helpful in policy framing and proper management of the available natural resources. In this study, changes in the land use and land cover for a three-decade period spanning from 1992 to 2020 have been monitored in the valley of Kashmir using remotely sensed satellite data obtained from USGS/NASA’s Landsat repository. Considerable changes in the LULC patterns were observed with a significant reduction in the area covered by water (18.21%), forest (13.56%), snow/glacial cover (29.32%) and agriculture (22.37%) during the past three decades. Concurrently, expansion in the land covered by urban areas (22.33%), barren land (37.32%), plantation (14.53%) and marshes (13.21%) were noted. The calculated Normalized Difference Water Index (NDWI) confirmed an overall reduction of 51.1% in the water and glacial cover of the study area. Significant changes in the form of forest, water and glacial cover transforming into urban, marshy and barren areas can be largely accredited to increased human interference that may have serious repercussions on the environment.
This is a preview of subscription content, log in via an institution to check access.
Access this article
Subscribe and save.
- Get 10 units per month
- Download Article/Chapter or eBook
- 1 Unit = 1 Article or 1 Chapter
- Cancel anytime
Price includes VAT (Russian Federation)
Instant access to the full article PDF.
Rent this article via DeepDyve
Institutional subscriptions
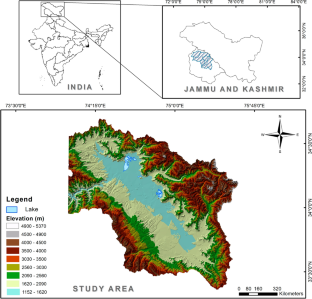
Assessing climatic impacts on land use and land cover dynamics in Peshawar, Khyber Pakhtunkhwa, Pakistan: a remote sensing and GIS approach

GIS and remote sensing-based analysis of the impacts of land use/land cover change (LULCC) on the environmental sustainability of Ekiti State, southwestern Nigeria

Monitoring and assessment of seasonal land cover changes using remote sensing: a 30-year (1987–2016) case study of Hamoun Wetland, Iran
Data availability.
The datasets generated during and/or analysed during the current study are available from the USGS EarthExplorer repository, ‘ https://earthexplorer.usgs.gov/ ’.
Abdulkareem J H, Sulaiman W N A, Pradhan B and Jamil N R 2018 Long-term hydrologic impact assessment of non-point source pollution measured through land use/land cover (LULC) changes in a tropical complex catchment; Earth Syst. Environ. 2(1) 67–84.
Article Google Scholar
Ahmed R, Ahmad S T, Wani G F, Ahmed P, Mir A A and Singh A 2022 Analysis of landuse and landcover changes in Kashmir valley, India – a review; GeoJournal 87(5) 4391–4403.
Alam A, Bhat M S and Maheen M 2020 Using Landsat satellite data for assessing the land use and land cover change in Kashmir valley; GeoJournal 85(6) 1529–1543.
Basnyat P, Teeter L D, Lockaby B G and Flynn K M 2000 The use of remote sensing and GIS in watershed level analyses of non-point source pollution problems; For. Ecol. Manag. 128(1–2) 65–73.
Campbell J B and Wynne R H 2011 Introduction to remote sensing ; Guilford Press.
Google Scholar
Congalton R G and Green K 2019 Assessing the accuracy of remotely sensed data: Principles and practices ; CRC Press.
Congalton R G, Plourde L and Bossler J 2002 Quality assurance and accuracy assessment of information derived from remotely sensed data; Man. Geo-Spat. Sci. Technol ., pp. 349–361.
Diallo Y, Hu G and Wen X 2009 Applications of remote sensing in land use/land cover change detection in Puer and Simao Counties, Yunnan Province; J. Am. Sci. 5(4) 157–166.
Elmahdy S, Mohamed M and Ali T 2020 Land use/land cover changes impact on groundwater level and quality in the northern part of the United Arab Emirates; Rem. Sens. 12(11) 1715.
Enderle D I and Weih R C Jr 2005 Integrating supervised and unsupervised classification methods to develop a more accurate land cover classification; J. Ark. Acad. Sci. 59(1) 65–73.
Fayaz A, ul Shafiq M, Singh H and Ahmed P 2020 Assessment of spatiotemporal changes in land use/land cover of North Kashmir Himalayas from 1992 to 2018; Model. Earth Syst. Environ. 6 1189–1200.
Ganaie T A, Jamal S and Ahmad W S 2021 Changing land use/land cover patterns and growing human population in Wular catchment of Kashmir Valley, India; GeoJournal 86 1589–1606.
Gazi M Y, Rahman M Z, Uddin M M and Rahman F A 2021 Spatio-temporal dynamic land cover changes and their impacts on the urban thermal environment in the Chittagong metropolitan area, Bangladesh; GeoJournal 86 2119–2134.
Grecchi R C, Gwyn Q H J, Bénié G B, Formaggio A R and Fahl F C 2014 Land use and land cover changes in the Brazilian Cerrado: A multidisciplinary approach to assess the impacts of agricultural expansion; Appl. Geogr. 55 300–312.
Güler M, Yomralıoğlu T and Reis S 2007 Using landsat data to determine land use/land cover changes in Samsun, Turkey; Environ. Monit. Assess. 127 155–167.
Gupta S and Gupta S 2018 Forests, state and people: a historical account of forest management and control in J&K; Contesting Conserv.: Shahtoosh Trade For. Manag. J&K, India , pp. 121–141.
Iqbal M and Sajjad H 2014 Watershed prioritization using morphometric and land use/land cover parameters of Dudhganga Catchment Kashmir Valley India using spatial technology; J. Geophys. Remote Sens. 3(1) 1–12.
Jensen J R 1996 Introductory digital image processing: R remote sensing perspective ; Univ. of South Carolina Columbus.
Kantakumar L N and Neelamsetti P 2015 Multi-temporal land use classification using hybrid approach; Egypt. J. Remote Sens. Space Sci. 18(2) 289–295.
McFeeters S K 1996 The use of the Normalized Difference Water Index (NDWI) in the delineation of open water features; Int. J. Remote Sens. 17(7) 1425–1432.
Nie W, Yuan Y, Kepner W, Nash M S, Jackson M and Erickson C 2011 Assessing impacts of Landuse and Landcover changes on hydrology for the upper San Pedro watershed; J. Hydrol. 407(1–4) 105–114.
Owuor S O, Butterbach-Bahl K, Guzha A C, Rufino M C, Pelster D E, Díaz-Pinés E and Breuer L 2016 Groundwater recharge rates and surface runoff response to land use and land cover changes in semi-arid environments; Ecol. Process. 5 1–21.
Petropoulos G P, Kalivas D P, Georgopoulou I A and Srivastava P K 2015 Urban vegetation cover extraction from hyperspectral imagery and geographic information system spatial analysis techniques: Case of Athens, Greece; J. Appl. Remote Sens. 9(1) 1–18.
Pramit V, Aditya R, Srivastava P K and Raghubanshi A S 2020 Appraisal of kappa-based metrics and disagreement indices of accuracy assessment for parametric and nonparametric techniques used in LULC classification and change detection; Model. Earth Syst. Environ. 6 1045–1059.
Purkis S J and Klemas V V 2011 Remote sensing and global environmental change ; John Wiley & Sons.
Book Google Scholar
Rashid I and Aneaus S 2020 Landscape transformation of an urban wetland in Kashmir Himalaya, India using high-resolution remote sensing data, geospatial modeling, and ground observations over the last 5 decades (1965–2018); Environ. Monit. Assess. 192(10) 635.
Rasool R, Fayaz A, ul Shafiq M, Singh H and Ahmed P 2021 Land use land cover change in Kashmir Himalaya: Linking remote sensing with an indicator based DPSIR approach; Ecol. Indic. 125 107447.
Rather N A, Lone P A, Reshi A A and Mir M M 2013 An analytical study on production and export of fresh and dry fruits in Jammu and Kashmir; Int. J. Sci. Res. Publ. 3(2) 1–7.
Romshoo S A, Dar R A, Rashid I, Marazi A, Ali N and Zaz S N 2015 Implications of shrinking cryosphere under changing climate on the streamflows in the Lidder catchment in the Upper Indus Basin, India; Arct. Antarct. Alp. Res. 47(4) 627–644.
Van der Werf G R, Morton D C, DeFries R S, Olivier J G, Kasibhatla P S, Jackson R B, Collatz G J and Randerson J T 2009 CO 2 emissions from forest loss; Nat. Geosci. 2(11) 737–738.
Weih R C and Riggan N D 2010 Object-based classification vs. pixel-based classification: Comparative importance of multi-resolution imagery; The Int. Arch. Int. Arch. Photogramm. Remote Sens. Spat. Inf. Sci. – ISPRS Arch. 38(4) C7.
Download references
Author information
Authors and affiliations.
Department of Civil Engineering, Indian Institute of Technology Bombay, Powai, Mumbai, 400 076, India
Injila Hamid
Public Works (R&B) Department, Govt. of J&K, Jammu & Kashmir, India
Lateef Ahmad Dar
Civil Engineering Program, Middle East Technical University, Northern Cyprus Campus, Kalkanlı, Guzelyurt, Mersin 10, Turkey
Injila Hamid & Bertug Akintug
You can also search for this author in PubMed Google Scholar
Contributions
Injila Hamid carried out an extensive literature review and contributed to collecting the data, carrying out the trend analysis of changing LULC patterns and preparing the manuscript. Lateef Ahmad Dar contributed in data collection, data analysis and manuscript preparation. Bertug Akintug provided guidance and contributed in preparing the manuscript.
Corresponding author
Correspondence to Injila Hamid .
Additional information
Communicated by Saumitra Mukherjee
Rights and permissions
Springer Nature or its licensor (e.g. a society or other partner) holds exclusive rights to this article under a publishing agreement with the author(s) or other rightsholder(s); author self-archiving of the accepted manuscript version of this article is solely governed by the terms of such publishing agreement and applicable law.
Reprints and permissions
About this article
Hamid, I., Dar, L.A. & Akintug, B. Assessing land use land cover change using remote sensing and GIS techniques: A case study of Kashmir Valley. J Earth Syst Sci 133 , 168 (2024). https://doi.org/10.1007/s12040-024-02369-1
Download citation
Received : 18 March 2023
Revised : 01 April 2024
Accepted : 03 April 2024
Published : 31 August 2024
DOI : https://doi.org/10.1007/s12040-024-02369-1
Share this article
Anyone you share the following link with will be able to read this content:
Sorry, a shareable link is not currently available for this article.
Provided by the Springer Nature SharedIt content-sharing initiative
- Cohen’s Kappa coefficient
- Geographic Information System (GIS)
- Land Use Land Cover (LULC)
- Remote Sensing
- Find a journal
- Publish with us
- Track your research
GeographyCaseStudy.Com
Detailed resources for pre-university Geography students
Case study: Glastonbury Festival
By Matt Burdett, 30 November 2017
On this page, we look at the UK’s Glastonbury music festival as a case study of one festival in a rural location, its site factors and geographic impacts.
Note: For ease of international comparison, all financial figures have been converted to US dollars at a rate of GBP1 to USD1.35.
Welcome to the Glastonbury Festival!

Docherty, R. 2015. Glastonbury Festival 2015. https://www.flickr.com/photos/fussyonion/19302015185 Accessed 1st December 2017.
Glastonbury Festival is the UK’s largest music festival. It has been held on Worthy Farm near Glastonbury most years since 1970, when it was started by Michael Eavis. He and his daughter Emily are still the main people in charge of the festival. Over 200,000 people went in 2017. The festival usually lasts three or four nights.
Where is Glastonbury?
The Glastonbury Festival takes place on Worthy Farm, near Glastonbury in south west England. The nearest major city is Bristol, about 40km away.

- Source: Noebse, 2006. Glastonbury – Somerset dot [map]. https://upload.wikimedia.org/wikipedia/commons/f/f9/Glastonbury_-_Somerset_dot.png Accessed 1st December 2017
Key facts about the festival
Glastonbury started off as a small festival but has grown substantially (BBC News, 2010). The following two graphs show the increase in attendance and ticket price, and during the following years the trend continued:

- 40 years of attendance at Glastonbury. BBC News, 2010. Glastonbury gates open to festival goers. http://www.bbc.co.uk/news/10387611 Accessed 1st December 2010.

- Glastonbury ticket prices over 40 years. BBC News, 2010. Glastonbury gates open to festival goers. http://www.bbc.co.uk/news/10387611 Accessed 1st December 2010.
As the annual festival has grown, so have the temporary secondary tourist resources that are required – over 200,000 people come to an area usually populated by just a few thousand. The local area does not have permanent facilities to cope with such a large number of people, so temporary and portable facilities are provided. The following were provided in 2017 (Belfast Telegraph, 2017):
- 514 food stalls
- 900 shops, including 150 that take card payments.
- 5,000 toilets provided.
- 3,000,000 gallons of water.
- Accommodation for the vast majority of the festival-goers is in one million square metres of public camping space.
Factors affecting the choice of site
The original factor affecting the choice of site was because the idea for the festival came from Michael Eavis who owned Worthy Farm, where the festival has been held ever since.
A rural site is required, since an urban area could not easily provide the space necessary. A huge site is used for the festival – it is over 360 hectares (Belfast Telegraph, 2017). This is larger than Worthy Farm, so over 21 different landowners contribute land to the temporary festival in addition to the main site (BBC News, 2016).
Another benefit of the site is the low population in the vicinity. The nearest town, Glastonbury, has a population of less than 10,000 so disruption to a large population is avoided.
However, an unusual limitation for a site this large is that it is not near a major transport route. The nearest motorway (major highway) is around 27km away. Congestion on narrow rural roads is a major issue during the festival weekend.
A complicating factor is soil erosion. Because the soil needs to recover after the festival, every few years there is a ‘fallow’ year in which the festival doesn’t take place. This happened in 2012 and 2018. There is pressure to find an alternative location, such as Longleat which is a country estate about 20km from Worthy Farm. However, this is a difficult problem to solve because of local opposition to such a large festival taking place in a new area (Rawlinson, 2016). No decision has yet been published about the choice of alternative venue for future years.
Costs and benefits
Costs and benefits can be analysed using thematic approach. Below, the themes of social, economic, and environmental issues are discussed.
Economic impacts
- About 100 people are permanently employed to run the festival.
- In 2017 the festival spent over US$8 million with local companies (Glastonbury Festival, 2017a).
- A 2007 study showed that the average person spent about US$180 on site and roughly the same off-site in the local area (Mendip D.C., 2007).
- Each year the festival raises US$1.35 million for charities.
Social impacts
- Crime is low, but present with 188 crimes reported to police in 2017, with 71 people arrested compared to 40 in 2016 (Herbaux, 2017). Figures on the impact on local residents are not available.
- Each year the festival has a ‘health focus’ and in 2015 it was blood donation leading to an increase in blood stocks in the area (Glastonbury Festival, 2017b).
- Glastonbury benefits from a greater ‘reach’ to tourists from other places – in 2007 over 700 journalists from around the world reported on the festival (Mendip D.C., 2007).
Environmental impacts
- The physical soil degradation from trampling means the land requires a year off every six years or so. Recent “fallow” years include 2012 and 2018 (BBC News, 2016)
- High energy consumption – over 120 generators are required, with a 2014 study showing that many of them were inefficient because they were oversized (Powerful Thinking, 2017).
- Renewable energy can be used. In the Green Fields coordinators camp a 1.5 kW solar unit (plus 22 kWh of battery storage) has been used to supply steady energy (Powerful Thinking, 2017).
- Although around two thirds of the visitors arrive by car, causing traffic congestion and air pollution, the emissions of carbon dioxide may be lower than those people remaining at home because during the festival they stay in tents. However this is a complex issue and no comprehensive study has been done.
- Noise pollution: some individuals have claimed that the festival can be heard over 8km away (Newman, 2017)
BBC News, 2010. Glastonbury gates open to festival goers. http://www.bbc.co.uk/news/10387611 Accessed 1st December 2010.
BBC News, 2016. Glastonbury Festival: ‘No plans to move for fallow year’. http://www.bbc.com/news/entertainment-arts-37340905 Accessed 1st December 2017.
Belfast Telegraph, 2017. The key facts and figures as Glastonbury Festival marks its 35th year. https://www.belfasttelegraph.co.uk/entertainment/music/news/the-key-facts-and-figures-as-glastonbury-festival-marks-its-35th-year-35855008.html Accessed 1st December 2017.
Glastonbury Festival, 2017a. Local Benefits. http://www.glastonburyfestivals.co.uk/worthy-causes/local-benefits/ Accessed 1st December 2017.
Glastonbury Festival, 2017b. Worthy Causes. http://www.glastonburyfestivals.co.uk/worthy-causes/nhsbt/ Accessed 1st December 2017.
Herbaux, C., 2017. Number of people arrested at Glastonbury 2017 rises but overall crime rate remains low. http://www.somersetlive.co.uk/news/somerset-news/number-people-arrested-glastonbury-2017-137724 Accessed 1st December 2017.
Mendip District Council [Mendip D.C.], 2007. Glastonbury Festivals 2007 Economic Impact Assessment. http://www.mendip.gov.uk/glastonburyfestivaleia Accessed 1st December 2017.
Newman, T., 2017. Personal conversation with the author.
Noebse, 2006. Glastonbury – Somerset dot [map]. https://upload.wikimedia.org/wikipedia/commons/f/f9/Glastonbury_-_Somerset_dot.png Accessed 1st December 2017
Powerful Thinking, 2017. Comprehensive Energy Monitoring Project with Agrekko and UWE. http://www.powerful-thinking.org.uk/casestudy/glastonbury-festival/ Accessed 1st December 2017.
Rawlinson, K. 2016. Glastonbury festival to move from Worthy Farm in 2019, says founder. https://www.theguardian.com/music/2016/dec/19/glastonbury-festival-to-move-from-worthy-farm-in-2019-says-founder Accessed 1st December 2017
Case study: Glastonbury Festival: Learning activities
- Describe the location of the Glastonbury festival. [3]
- Suggest reasons why the site is suitable for a large temporary festival. [4]
- Suggest reasons why the site is unsuitable for a large temporary festival. [4]
- Describe the economic costs of the festival. [3]
- Explain why the social impacts may be considered positive overall, rather than negative. [4]
- Explain why charities such as Greenpeace have participated in the festival despite the environmental problems it causes. [4]
Other tasks
Imagine you are going to Glastonbury festival. You have decided to try to raise awareness amongst your fellow music fans about the impacts of the festival. Are you going to:
- Persuade them of the problems the festival causes
- Congratulate them for making a positive impact on the local area
Think carefully – consider both the issues at stake and the audience. Produce a large poster or sign with a slogan that supports your view.
Going further
- http://www.essaywriting.expert/the-environmental-impacts-of-glastonbury-music-festival-essay/ This is an example of an essay about the festival, but beware: the sources are not listed in the free version of the essay (though in-text citations are provided), and the essay dates from 2014.
- https://impactoffestivals.wordpress.com/project-outputs/reports-and-papers/ This is a link list to many useful sections of a project about the impact of festivals in the UK.
- https://rumercooper.wordpress.com/university-year-1/tm4005-introduction-to-events-management/tm4005-glastonbury-impacts-on-location/ A well referenced account of the impact of Glastonbury, though with some errors in the quality of written English.
- http://www.rgs.org/OurWork/Schools/Teaching+resources/Key+Stage+3+resources/Mapping+festivals/Greening+Glastonbury.htm A well written and approachable summary although sadly somewhat dated.
Share this:
- Already have a WordPress.com account? Log in now.
- Subscribe Subscribed
- Copy shortlink
- Report this content
- View post in Reader
- Manage subscriptions
- Collapse this bar

Case Study: How does Japan live with earthquakes?
Japan lies within one of the most tectonically active zones in the world. It experiences over 400 earthquakes every day. The majority of these are not felt by humans and are only detected by instruments. Japan has been hit by a number of high-intensity earthquakes in the past. Since 2000 there are have been 16000 fatalities as the result of tectonic activity.
Japan is located on the Pacific Ring of Fire, where the North American, Pacific, Eurasian and Philippine plates come together. Northern Japan is on top of the western tip of the North American plate. Southern Japan sits mostly above the Eurasian plate. This leads to the formation of volcanoes such as Mount Unzen and Mount Fuji. Movements along these plate boundaries also present the risk of tsunamis to the island nation. The Pacific Coastal zone, on the east coast of Japan, is particularly vulnerable as it is very densely populated.
The 2011 Japan Earthquake: Tōhoku
Japan experienced one of its largest seismic events on March 11 2011. A magnitude 9.0 earthquake occurred 70km off the coast of the northern island of Honshu where the Pacific and North American plate meet. It is the largest recorded earthquake to hit Japan and is in the top five in the world since records began in 1900. The earthquake lasted for six minutes.

A map to show the location of the 2011 Japan Earthquake
The earthquake had a significant impact on the area. The force of the megathrust earthquake caused the island of Honshu to move east 2.4m. Parts of the Japanese coastline dr[[ed by 60cm. The seabed close to the focus of the earthquake rose by 7m and moved westwards between 40-50m. In addition to this, the earthquake shifted the Earth 10-15cm on its axis.
The earthquake triggered a tsunami which reached heights of 40m when it reached the coast. The tsunami wave reached 10km inland in some places.
What were the social impacts of the Japanese earthquake in 2011?
The tsunami in 2011 claimed the lives of 15,853 people and injured 6023. The majority of the victims were over the age of 60 (66%). 90% of the deaths was caused by drowning. The remaining 10% died as the result of being crushed in buildings or being burnt. 3282 people were reported missing, presumed dead.
Disposing of dead bodies proved to be very challenging because of the destruction to crematoriums, morgues and the power infrastructure. As the result of this many bodies were buried in mass graves to reduce the risk of disease spreading.
Many people were displaced as the result of the tsunami. According to Save the Children 100,000 children were separated from their families. The main reason for this was that children were at school when the earthquake struck. In one elementary school, 74 of 108 students and 10 out of 13 staff lost their lives.
More than 333000 people had to live in temporary accommodation. National Police Agency of Japan figures shows almost 300,000 buildings were destroyed and a further one million damaged, either by the quake, tsunami or resulting fires. Almost 4,000 roads, 78 bridges and 29 railways were also affected. Reconstruction is still taking place today. Some communities have had to be relocated from their original settlements.
What were the economic impacts of the Japanese earthquake in 2011?
The estimated cost of the earthquake, including reconstruction, is £181 billion. Japanese authorities estimate 25 million tonnes of debris were generated in the three worst-affected prefectures (counties). This is significantly more than the amount of debris created during the 2010 Haiti earthquake. 47,700 buildings were destroyed and 143,300 were damaged. 230,000 vehicles were destroyed or damaged. Four ports were destroyed and a further 11 were affected in the northeast of Japan.
There was a significant impact on power supplies in Japan. 4.4 million households and businesses lost electricity. 11 nuclear reactors were shut down when the earthquake occurred. The Fukushima Daiichi nuclear power plant was decommissioned because all six of its reactors were severely damaged. Seawater disabled the plant’s cooling systems which caused the reactor cores to meltdown, leading to the release of radioactivity. Radioactive material continues to be released by the plant and vegetation and soil within the 30km evacuation zone is contaminated. Power cuts continued for several weeks after the earthquake and tsunami. Often, these lasted between 3-4 hours at a time. The earthquake also had a negative impact on the oil industry as two refineries were set on fire during the earthquake.
Transport was also negatively affected by the earthquake. Twenty-three train stations were swept away and others experienced damage. Many road bridges were damaged or destroyed.
Agriculture was affected as salt water contaminated soil and made it impossible to grow crops.
The stock market crashed and had a negative impact on companies such as Sony and Toyota as the cost of the earthquake was realised. Production was reduced due to power cuts and assembly of goods, such as cars overseas, were affected by the disruption in the supply of parts from Japan.
What were the political impacts of the Japanese earthquake in 2011?
Government debt was increased when it injects billions of yen into the economy. This was at a time when the government were attempting to reduce the national debt.
Several years before the disaster warnings had been made about the poor defences that existed at nuclear power plants in the event of a tsunami. A number of executives at the Fukushima power plant resigned in the aftermath of the disaster. A movement against nuclear power, which Japan heavily relies on, developed following the tsunami.
The disaster at Fukushima added political weight in European countries were anti-nuclear bodies used the event to reinforce their arguments against nuclear power.
Privacy Overview
| Cookie | Duration | Description |
|---|---|---|
| cookielawinfo-checkbox-analytics | 11 months | This cookie is set by GDPR Cookie Consent plugin. The cookie is used to store the user consent for the cookies in the category "Analytics". |
| cookielawinfo-checkbox-functional | 11 months | The cookie is set by GDPR cookie consent to record the user consent for the cookies in the category "Functional". |
| cookielawinfo-checkbox-necessary | 11 months | This cookie is set by GDPR Cookie Consent plugin. The cookies is used to store the user consent for the cookies in the category "Necessary". |
| cookielawinfo-checkbox-others | 11 months | This cookie is set by GDPR Cookie Consent plugin. The cookie is used to store the user consent for the cookies in the category "Other. |
| cookielawinfo-checkbox-performance | 11 months | This cookie is set by GDPR Cookie Consent plugin. The cookie is used to store the user consent for the cookies in the category "Performance". |
| viewed_cookie_policy | 11 months | The cookie is set by the GDPR Cookie Consent plugin and is used to store whether or not user has consented to the use of cookies. It does not store any personal data. |
Pin It on Pinterest
You must be logged in to post a comment.
- Open access
- Published: 31 August 2024
Spatial analysis of the impact of urban built environment on cardiovascular diseases: a case study in Xixiangtang, China
- Shuguang Deng 1 ,
- Jinlong Liang 1 ,
- Ying Peng 2 ,
- Wei Liu 3 ,
- Jinhong Su 1 &
- Shuyan Zhu 1
BMC Public Health volume 24 , Article number: 2368 ( 2024 ) Cite this article
Metrics details
The built environment, as a critical factor influencing residents' cardiovascular health, has a significant potential impact on the incidence of cardiovascular diseases (CVDs).
Taking Xixiangtang District in Nanning City, Guangxi Zhuang Autonomous Region of China as a case study, we utilized the geographic location information of CVD patients, detailed road network data, and urban points of interest (POI) data. Kernel density estimation (KDE) and spatial autocorrelation analysis were specifically employed to identify the spatial distribution patterns, spatial clustering, and spatial correlations of built environment elements and diseases. The GeoDetector method (GDM) was used to assess the impact of environmental factors on diseases, and geographically weighted regression (GWR) analysis was adopted to reveal the spatial heterogeneity effect of environmental factors on CVD risk.
The results indicate that the built environment elements and CVDs samples exhibit significant clustering characteristics in their spatial distribution, with a positive correlation between the distribution density of environmental elements and the incidence of CVDs (Moran’s I > 0, p < 0.01). Further factor detection revealed that the distribution of healthcare facilities had the most significant impact on CVDs ( q = 0.532, p < 0.01), followed by shopping and consumption ( q = 0.493, p < 0.01), dining ( q = 0.433, p < 0.01), and transportation facilities ( q = 0.423, p < 0.01), while the impact of parks and squares ( q = 0.174, p < 0.01) and road networks ( q = 0.159, p < 0.01) was relatively smaller. Additionally, the interaction between different built environment elements exhibited a bi-factor enhancement effect on CVDs. In the local analysis, the spatial heterogeneity of different built environment elements on CVDs further revealed the regional differences and complexities.
Conclusions
The spatial distribution of built environment elements is significantly correlated with CVDs to varying degrees and impacts differently across regions, underscoring the importance of the built environment on cardiovascular health. When planning and improving urban environments, elements and areas that have a more significant impact on CVDs should be given priority consideration.
Peer Review reports
Cardiovascular diseases (CVDs) have become one of the most common lethal diseases worldwide, with both the number of affected individuals and the mortality rate continuously rising over the past two decades. Statistical data reveal that from 1990 to 2019, the number of individuals with CVDs globally increased from 271 to 523 million, while deaths climbed from 12.1 million to 18.6 million, accounting for approximately one-third of the total annual global deaths [ 1 ]. The severity of CVDs poses not only a global health challenge but also exerts immense pressure on the healthcare system and the economy [ 2 ]. According to the World Heart Federation, global medical costs for CVDs are projected to rise from approximately 863 billion US dollars in 2010 to 1044 billion US dollars by 2030 [ 3 ]. Thus, it is particularly important to deeply explore the mechanisms that influence CVDs and to develop effective and sustainable strategies to reduce risk and prevent these diseases.
The urban built environment refers to the comprehensive physical structure and man-made surroundings of an urban area, including buildings, transportation systems, infrastructure, land use planning, and elements of natural and artificial spaces [ 4 ]. Numerous studies have focused on the close connection between the built environment and human health, particularly with respect to cardiovascular health. Research indicates that the impact of the built environment on cardiovascular health is a process network structure with various influencing factors, including but not limited to factors contributing to CVDs such as obesity, diabetes, high blood pressure [ 5 , 6 , 7 , 8 , 9 , 10 ], environmental issues like traffic noise and air pollution [ 11 , 12 ], as well as aspects of physical exercise, psychological stress, and lifestyle [ 13 , 14 , 15 , 16 , 17 ], all of which collectively affect the pathogenesis of CVDs [ 18 , 19 , 20 ]. Studies show that optimizing urban design, such as rational land allocation and planning street layouts, can guide people to access more life services, cultivate proactive attitudes and healthy bodies, thereby reducing the risk of CVDs [ 21 , 22 ]. Urban spatially compact development models can encourage physical activity, reducing the risk of cardiovascular and metabolic issues [ 23 ]. In contrast, long commutes and high traffic density may lead to chronic stress and lack of exercise, increasing the risk of obesity and hypertension. Conversely, appropriate intersection density, land-use diversity, destination convenience, and accessibility might encourage walking, improve health, and reduce the risk of obesity, diabetes, hypertension, and dyslipidemia, which are cardiovascular-related problems [ 24 , 25 , 26 ]. The density and accessibility of supermarkets have a direct impact on the dietary habits of community residents, wherein excessive density may increase the risk of obesity and diabetes and correlate with blood pressure levels [ 27 ]. Urban green spaces and outdoor recreational areas have a positive effect on cardiovascular health; green spaces not only offer places for exercise and relaxation but also help alleviate stress, improve mental states, and enhance air quality, thus mitigating the harm caused by air pollution and protecting cardiac and vascular health [ 28 ]. Research also indicates that individuals residing in areas with high greenery rates are more likely to enjoy opportunities that promote physical activity, mental health, and healthy lifestyles, thereby minimizing CVD risks [ 29 , 30 ]. In summary, scientific and rational urban planning, such as diversified land use, appropriate building density, good street connectivity, convenient destinations, short-distance commuting, and beautiful environments, are key factors in promoting overall health and preventing CVDs.
Although numerous studies have focused on exploring the relationship between the built environment and CVDs, the specific mechanisms underlying this relationship remain unclear. This knowledge gap is mainly due to the complexity of the built environment itself and the multifactorial pathogenesis of CVDs. Current research mostly concentrates on individual aspects of the built environment, such as noise, air pollution, green spaces, and transportation [ 31 ], lacking consideration for the overall complexity of the built environment. Many elements of the built environment are interactive; for instance, pedestrian-friendly urban design may enhance physical activity and social interaction, yet it could also be counteracted by air and noise pollution caused by urban traffic [ 32 ]. Therefore, the same element of the built environment might have different effects in different contexts, adding complexity to the study of the built environment. Furthermore, while existing research has exhibited considerable depth and breadth in exploring the complex and dynamic relationship between the built environment and CVDs, many areas still require further improvement and deepening. Traditional linear correlation analyses, such as OLS and logistic regression models, have been widely used to assess the significance level between built environment characteristics and CVDs mortality rates, and to investigate factors such as intersection density, slope, greening, and commercial density [ 33 , 34 ]. However, these methods fall short in addressing the complexity and non-linear characteristics of spatial data.
Therefore, from a geographical perspective, it is particularly important to adopt more appropriate methods to capture the non-stationarity and heterogeneity of spatial data and to explore the spatial correlation characteristics between the built environment and CVDs. However, current research utilizing spatial models has mainly focused on macro-level perspectives, such as national or provincial levels. For example, ŞENER et al. employed spatial autocorrelation models and hot spot analysis models to assess the spatiotemporal variation characteristics of CVD mortality across multiple provincial administrative regions [ 35 ]. Baptista et al. analyzed the impact of factors such as per capita GDP, urbanization rate, education, and cigarette consumption on the growth trends of CVD incidence using spatial lag and spatial error models across different countries or regions [ 36 ]. Eun et al. used Bayesian spatial multilevel models to measure built environment variables in 546 administrative districts of Gyeonggi Province, South Korea, and evaluated the impact of the built environment on CVDs [ 37 ]. While these studies have, to some extent, revealed the spatial distribution characteristics of CVDs and their spatial relationships with environmental features, the scope of these studies is often large, and they tend to overlook the heterogeneity at the micro-level within cities and its specific impact on residents' health. As a result, it is challenging to accurately capture the differential effects of the built environment on CVD incidence across different areas within a city, and many critical environmental factors at the micro-geographical scale, which are directly related to the daily lives and health of residents, may be obscured.
Given this, we focus on Xixiangtang District in Nanning City, China, and construct a research framework centered on multi-source data, including the distribution of CVDs, road networks, and urban POI data. By employing KDE to reveal hotspot areas, spatial autocorrelation analysis to explore spatial dependence, the GDM to dissect key factors, and GWR to capture the spatial heterogeneity effects, we deeply analyze the complex mechanisms by which the urban built environment influences the incidence of CVDs. Our study aims to answer: Is there a significant spatial association between urban built environment elements and the incidence rate of CVDs? To what extent do different built environment elements impact CVDs? And, what are the regional differences in the impact of built environment elements on CVDs in different areas?
This study focuses on Xixiangtang District in Nanning City (Fig. 1 ), an important administrative district located in the northwest of Nanning City, covering an area of approximately 1,276 square kilometers with a permanent population of over one million. As an exemplary early-developed area of Nanning City, the built environment of Xixiangtang not only carries a rich historical and cultural heritage but also witnesses the transformation from a traditional old town to a modern emerging area, forming a unique urban–rural transitional zone. However, with the acceleration of urbanization, Xixiangtang District also faces numerous environmental challenges, such as declining air quality, congested traffic networks, increasing noise pollution, and continuously rising population density, all of which may pose potential threats to residents' cardiovascular health. Therefore, choosing the built environment of Xixiangtang as the core area of this study is not only due to its representativeness but also because the issues faced by this area are of profound practical significance for exploring the health impacts of urbanization and formulating effective environmental improvement strategies.

Location of study area
The CVD case data is sourced from the cardiovascular department's medical records at Guangxi National Hospital. Located in the southeastern core area of Xixiangtang District, near metro stations and densely populated areas, the hospital's superior geographical location and convenient transportation conditions greatly facilitate patient visits, especially for those seeking high-level cardiovascular medical services. Although spatial distance is an important consideration for patients when choosing a medical facility, our study on the spatial distribution patterns of CVDs also takes into account various influencing factors, including socioeconomic status, environmental factors, patient health conditions, and healthcare-seeking behaviors, ensuring the depth and accuracy of the results. Additionally, Guangxi National Hospital is one of the few top-tier (tertiary A) comprehensive hospitals in Xixiangtang District, with its cardiovascular department being a key specialty. The department's outstanding reputation and wide influence, combined with its advantages in equipment, technology, and healthcare costs compared to other non-specialized cardiovascular departments in the region, make it particularly attractive to patients in Xixiangtang, thus rendering the data relatively representative. To ensure the fairness of our study results, we have implemented multiple verification measures, including comprehensive data collection, independent evaluation of medical standards, rigorous statistical analysis, and consideration of healthcare costs.
With authorization from Guangxi National Hospital, we obtained and analyzed the cardiovascular department's data records. Our study adheres to ethical principles and does not involve any operations that have a substantial impact on patients. The cardiovascular data records include basic patient information (such as age, gender, address, etc.), diagnostic information (disease type, diagnosis date, etc.), and treatment records. We focused on CVD patients diagnosed between January 1, 2020, and December 31, 2022. Through systematic screening and organization, we constructed a database of CVD patients during this period. During the data processing procedure, we implemented a rigorous data cleaning process, identifying and excluding incomplete, duplicate, or abnormal data records. This included checking for missing data, logical errors (such as extremely large or small ages), and consistency in diagnostic codes, ensuring the quality and reliability of the data. After data cleaning, we selected 3,472 valid samples, which are representative in terms of disease types, patient characteristics, and geographic distribution. Considering the study involves geographic location analysis, we used a text-to-coordinate tool developed based on the Amap (Gaode) API to convert patient address information into precise geographic coordinates. Finally, using ArcGIS 10.8 software, we visualized the processed case data on a map.
As a multidimensional and comprehensive conceptual framework, the built environment encompasses a vast and intricate system of elements. Given the accessibility, completeness of data, and the robust foundation in current research domains, we have centered our in-depth analysis on two core components: the urban road system and urban POIs. Road data is primarily sourced from OpenStreetMap (OSM) and processed using ArcGIS 10.8 to filter and handle incomplete records. We ultimately selected five types of roads for analysis: highways, expressways, arterial roads, secondary roads, and local roads [ 38 ]. Urban POI data was selected based on existing research and obtained through Amap. Amap is a leading map service provider in China, known for its vast user data, precise geocoding system, and advanced intelligent analysis technology, which accurately captures and presents the spatial distribution and attribute characteristics of various urban facilities. We used Amap's API interface and offline map data package to obtain the coordinates and basic attributes of POIs in the study area, including six key environment elements: dining [ 39 ], parks [ 40 ], transportation [ 20 ], shopping [ 41 ], sports [ 42 ], and healthcare [ 43 ] (Table 1 ). These elements significantly reflect the distribution status of the urban built environment. This comprehensive and detailed data provides a solid foundation for further exploring the relationship between the built environment and cardiovascular health.
- Spatial analysis
Based on existing research findings, we have identified key built environment factors that influence the occurrence of cardiovascular diseases (CVDs) and meticulously processed the data sourced from [ 34 , 35 , 44 ]. The preprocessed data was then subjected to spatial analysis utilizing software tools such as ArcGIS 10.8, Geoda, and the Geographic Detector. Through various methods including KDE, spatial autocorrelation analysis (encompassing both univariate and bivariate analyses), factor detection and interaction detection using the Geographic Detector, as well as GWR, we aimed to explore the potential links between the urban built environment and CVDs (Fig. 2 ).

Research framework
Kernel Density Estimation (KDE)
Before delving into the complex relationship between the built environment and CVDs, it is crucial to accurately depict the spatial distribution of these key elements within the study area. Given this need, KDE, an advanced non-parametric statistical technique, was introduced as our core analytical tool. KDE is a non-parametric method used to estimate the probability density function of a random variable, and we implemented it using ArcGIS 10.8 software. Compared to other density estimation methods, such as simple counting or histograms, KDE more accurately reflects the true distribution of spatial elements, helping us identify hotspots and cold spots in the city with greater precision. The core of this method lies in assigning a smooth kernel function to each observation point, which describes the influence range of the observation point on its surrounding space, known as bandwidth. The density distribution map of the entire area is then obtained by overlaying the kernel functions of all observation point [ 45 , 46 , 47 ]. In parameter settings, we set the cell size to 100 m, based on a comprehensive consideration of the study area's scope, the distribution characteristics of geographic phenomena, and computational resource limitations. This aimed to maintain sufficient precision while avoiding excessive computational burden and amplification of data noise. To further refine the analysis and visually present the continuous spatial distribution of CVDs, we used the natural breaks method to classify the KDE results into five levels. KDE visually displays the continuous spatial distribution of CVDs, identifying high-risk and low-risk areas, and provides foundational data support for subsequent spatial analyses.
Spatial autocorrelation analysis
Spatial autocorrelation analysis is a statistical method used to assess the similarity or correlation between observed values in geographic space. We derived the point attribute values from the kernel density transformation and conducted univariate global spatial autocorrelation analysis, as well as bivariate global spatial autocorrelation analysis between built environment factors and CVDs using Geoda software. Univariate global spatial autocorrelation analysis was used to study the spatial distribution characteristics of the overall dataset, using Moran's I to evaluate whether the dataset exhibits spatial autocorrelation, indicating clustering or dispersion trends [ 48 , 49 ]. Bivariate global spatial autocorrelation further analyzed the spatial correlation between different indicators [ 50 , 51 ]. Spatial autocorrelation analysis helps verify whether the spatial clustering in KDE results is significant and preliminarily explores whether there is spatial interdependence between environmental factors and CVDs.
The results of spatial autocorrelation analysis include the Moran's I index, which directly reflects the strength and direction of spatial autocorrelation, as well as key indicators such as p values and Z values, together constructing a comprehensive quantitative system for evaluating spatial autocorrelation. In the results of spatial autocorrelation analysis, when the p -value is less than 0.01, the confidence level reaches 99%, and the Z value is greater than 2.58, the null hypothesis can be rejected, indicating that the research results are highly reliable. The degree of spatial clustering of variables is measured by Moran's I. The range of Moran's I is [-1, 1]; if Moran's I > 0, it indicates positive correlation, with higher values indicating stronger clustering; if Moran's I < 0, it indicates negative correlation, with lower values indicating stronger clustering; and if Moran's I = 0, the variables are not clustered and show a dispersed distribution, with the correlation weakening as the value approaches 0 [ 52 ].
The GeoDetector method (GDM)
We analyzed the processed kernel density attribute data using the GDM to parse the influence of the built environment on CVDs and uncover the underlying driving factors. The geographic detector tool was developed by a team led by Researcher Jinfeng Wang at the Institute of Geographic Sciences and Natural Resources Research, Chinese Academy of Sciences [ 53 ]. The GDM mainly includes factor detection, interaction detection, risk area detection, and ecological detection, and it has been widely applied in multiple fields. We used the factor detection function to evaluate the impact of environmental factors on the distribution of CVDs and utilized the interaction detection function to analyze the interaction between different environmental factors [ 54 , 55 ]. The purpose of the factor detector is to detect the extent to which independent variables explain the spatial differentiation of the dependent variable. It quantifies the influence of independent variables on the spatial distribution of the dependent variable to reveal which factors are the main contributors to the spatial distribution differences of the dependent variable. However, the impact of built environment elements on CVDs may not be determined by a single factor but rather by the synergistic effect of multiple built environment factors. Therefore, through the means of interaction detection, we further analyzed the synergistic impact of pairs of built environment elements on the spatial distribution of CVDs.
In this analysis, the q value was used as a quantitative indicator of the influence of environmental factors on CVDs, with values ranging between [0,1]. A higher q value indicates a more significant influence of the environmental factor, whereas a lower q value indicates a smaller influence. Additionally, a significance level of p < 0.01 further emphasizes the reliability of these factors' significant impact on the distribution of CVD samples.
Geographically Weighted Regression (GWR)
However, while the GDM can reveal the overall impact of built environment elements on CVDs, its limitation lies in its difficulty to finely characterize the specific differences and dynamic changes of these impacts within different geographic spatial units. To address this shortcoming, we introduced the GWR model through the spatial analysis tools of ArcGIS 10.8 software for local analysis. This model dynamically maps the distribution and variation trajectory of regression coefficients in geographic space, incorporating the key variable of spatial location into the regression analysis. In this way, the GWR model can reveal the spatial heterogeneity of parameters at different geographic locations, accurately capturing the relationships between local variables, thus overcoming the limitations of traditional global regression models in handling spatial non-stationarity [ 56 , 57 ]. Compared to traditional global regression models, the GWR model excels in reducing model residuals and improving fitting accuracy.
When interpreting the results of the GWR model, it is necessary to consider the regression coefficients, R 2 (coefficient of determination), and adjusted R 2 comprehensively. The dynamic changes in regression coefficients in space reveal the complex relationships between independent and dependent variables at different geographic locations, with their sign and magnitude directly reflecting the nature and intensity of the impact. Although the R 2 value, as an indicator of the model's goodness of fit, focuses more on local effects in the GWR, its variation still helps to assess the explanatory power of the model in each area. These comprehensive indicators together form a thorough evaluation of the GWR model's performance. Through a comprehensive evaluation of the GWR model results, we can more precisely capture the relationships between local variables, revealing the specific impact of environmental factors on CVD risk within different regions.
Kernel density distribution characteristics
By applying kernel density analysis, the spatial distribution pattern of CVD samples and various built environment elements was detailed, effectively capturing their spatial density characteristics. The obtained kernel density levels were divided into five tiers using the natural breaks method and arranged in descending order, as shown in Fig. 3 . Analysis results indicate that high-density areas of elements such as shopping, dining, transportation facilities, and medical care are mainly focused in the southeastern part of the city, i.e., the city center. The high-density areas of the road network extend along the southern Yonjiang belt and appear patchy in the city center. Dense areas of parks are mostly near the southern riverside areas, while high-density distributions of sports facilities extend in the southeastern and central regions. Overall, the distribution pattern of these environmental factors reveals that Xixiangtang District's development trend mainly extends from southeast to northwest, indicating that the northeastern part of the region is relatively underdeveloped, with a sparse population and a lack of various infrastructure layouts. Additionally, kernel density distribution characteristics show that high-incidence areas of CVDs are concentrated in the southeast, highly coinciding with the high-density areas of most built environment elements.

Distribution of nuclear density of each element in the study area
Spatial Autocorrelation Characteristics
To explore the spatial relationship between urban built environment elements and the distribution of CVDs, spatial autocorrelation analysis was performed using Geoda software [ 58 ]. The study involved univariate and bivariate global spatial autocorrelation analyses (Table 2 ). The results of the analysis passed the significance level test at 0.01, with p values below 0.01 and Z values exceeding 2.58, achieving a 99% confidence level. This reinforces the reliability of the spatial autocorrelation results.
Univariate analysis is used to evaluate the clustering or dispersion status of feature points in space. In univariate analysis, the Moran's I value of the road network was 0.957, which significantly indicates a clustering trend in its spatial distribution. Moran's I values for other built environment elements, such as parks, transportation facilities, sports and fitness, and medical care, all exceeded 0.9, while the Moran's I values for shopping and dining also surpassed 0.8. By comparison, the Moran's I value for CVD samples was 0.697, approaching 0.7, revealing significant aggregation. Overall, the clustering nature of the built environment elements and CVD samples in Xixiangtang District implies that these elements are not randomly deployed but follow some patterns of hierarchical assembly.
Bivariate analysis, on the other hand, is used to evaluate the spatial correlation between different environmental factors and CVDs. Bivariate analysis further revealed the spatial interaction between environmental factors and CVDs. The results show that all considered environmental elements exhibited significant positive correlation with CVDs. The spatial association between medical care elements and CVDs was the strongest, with a Moran's I value of 0.431, surpassing the significant threshold of 0.4. Additionally, the Moran's I values for dining, transportation facilities, shopping, and sports and fitness were all over 0.3. Road networks and parks, on the other hand, showed relatively weaker correlations with CVDs, with Moran's I values around 0.1, indicating that in that region, the spatial connection between these built environment elements and CVDs is comparably weak.
Geodetector results analysis
A detailed analysis of the impact of various environmental factors on CVDs was achieved through the factor detection model of the GDM. According to the factor detection results shown in Table 3 , significant differences in the impact of environmental factors on the distribution of CVD samples were observed. The analysis results indicate that the environmental factors influencing the distribution of CVDs, in descending order of impact, are: healthcare services > shopping > dining > transportation facilities > sports and fitness > parks and squares > road networks. Specifically, healthcare services lead with a q value of 0.532, indicating that the spatial distribution of healthcare services has the most significant impact on the spatial distribution of CVDs. This highlights the importance of a high-density layout of healthcare facilities in the prevention and treatment of CVDs and suggests that individuals at risk for CVDs tend to prefer living in areas with convenient access to medical services [ 59 ].
Subsequently, shopping, dining, and transportation facilities all have q values exceeding 0.4, reflecting their significant effects on the urban built environment's clustering characteristics and regional commercial vitality. The concentration of human traffic brought about by these factors may, while increasing residents' lifestyle choices, also lead to certain psychological burdens and declining air quality, thereby indirectly placing a burden on the cardiovascular system. In contrast, parks and squares and road networks have relatively low q values (both less than 0.2), suggesting that the incidence of CVDs is lower in areas concentrated with these environmental elements, likely related to their ecological and transportation benefits.
Subsequently, interaction detection was used to analyze the synergistic impact of pairs of built environment elements on the spatial distribution of CVDs. From the results shown in Table 4 , it is evident that any two built environment elements exhibit a bi-factor enhancement effect on CVDs, suggesting that the combined influence of two built environment elements exceeds the effect of a single element. Among these, the interaction between healthcare services and shopping has the greatest impact on CVDs, with a value of 0.571. This indicates that CVDs patients or high-risk individuals tend to prefer living in areas rich in healthcare resources and convenient for shopping, as they can more easily access health services and daily necessities. Conversely, the interaction between road networks and parks and squares has the weakest impact on CVDs, with a value of 0.313. This suggests that their combined effect in reducing CVD risk is relatively limited, possibly due to the negative impacts of road networks, such as traffic congestion and air pollution, which may offset some of the health benefits provided by parks and squares. This result further validates an important point: the impact of the built environment on CVDs is not driven by a single element but by the synergistic effects of multiple environmental factors working together.
Geographically weighted regression analysis
The GDM revealed the influence of built environment factors on CVDs. To further uncover the spatial heterogeneity effects of built environment elements on CVDs in different regions, we employed the GWR model. To ensure the rigor of the analysis, we conducted multicollinearity detection for all built environment elements before establishing the model. We confirmed that the Variance Inflation Factor (VIF) values for all elements did not exceed the conventional threshold of 5, effectively avoiding multicollinearity issues and ensuring the robustness of the model results. The GWR model results showed that the model's coefficient of determination R 2 was 0.596, and the adjusted R 2 was 0.575, indicating that the model could adequately explain the relationships between variables in the study. The analysis results also highlighted the spatial non-stationarity of the effects of built environment elements, manifested by different degrees of variation and fluctuation characteristics, as shown by the coefficient magnitudes and their dynamic changes in spatial distribution in Table 5 .
Looking more closely at the details, as demonstrated in Fig. 4 , the regression coefficients of the dining elements fluctuated relatively little, ranging from -0.372 to 0.471, reflecting a relatively balanced spatial effect. Moreover, although this factor's impact in the Xixiangtang District showed both positive and negative aspects in different areas, more than half of the analysis units indicated positive values, especially in the southern and northeastern parts of the Xixiangtang District. In contrast, the high-incidence areas of CVDs in the eastern part and areas in the north showed negative correlations.

Spatial distribution of regression coefficient of built-up environmental factors
The GWR coefficients and their fluctuations for parks were significant, ranging from -69.757 to 35.43, indicating significant spatial differences in their impact on the distribution of CVDs. Specifically, the spatial distribution of positive and negative impacts was nearly 1:1, revealing the complexity of its effects. In high-incidence areas of CVDs, the distribution of parks showed a significantly negative correlation with disease distribution, while a significant increase in positive correlation was observed north of the significantly negative regions. This implies the presence of other moderating factors influencing the direction of the impact of parks on CVDs.
The regression coefficients and fluctuations for shopping were the smallest among the seven environmental factors, confined to a range of -0.093 to 0.219, suggesting a high consistency in its spatial effects. In the Xixiangtang built-up area, nearly two-thirds of the spatial units yielded positive impacts. Particularly in the northern, northeastern, southern, and southeastern regions, the positive impacts of shopping were especially pronounced.
The regression coefficients and fluctuations for transportation facilities were relatively large, ranging from -0.487 to 7.363. For the Xixiangtang District, nearly three-quarters of the analysis units displayed positive spatial impacts, with the largest positive value areas concentrated in the southeastern part. However, areas with negative impacts from transportation facilities were relatively fewer, suggesting a clear positive correlation with the distribution of CVDs.
The fluctuation range for sports and fitness regression coefficients was also broad, from -10.578 to 33.256. The analysis indicated that only a quarter of the analysis units in the Xixiangtang District had a positive correlation. The most significant positive values were located near the high-density areas for CVDs, suggesting that sports and fitness facilities might have a positive correlation with the disease distribution in these areas. Meanwhile, the intensity of the negative correlation increased north of the areas with significant positive values, potentially pointing to other factors' potential moderating effects on the relationship between sports and CVDs.
The regression coefficients and their fluctuations for healthcare were relatively small, ranging from -1.235 to 3.352. In the Xixiangtang District, the vast majority of analysis units showed a positive correlation, especially in the northern regions. The southern areas exhibited negative correlations, highlighting potential differences in medical resources in that region.
Of all the built environment elements, road networks had the largest range of regression coefficients and fluctuations, swinging from -7905.743 to 411.617, demonstrating extremely strong spatial variability. Only a small portion of the spatial units in the Xixiangtang District showed positive correlations, while the significantly negative regions were mostly concentrated in high-incidence areas for CVDs. This phenomenon was similar to the negative correlation distribution trend of parks, pointing to a significantly negative correlation between park distribution and the distribution of CVDs. Notably, the effect of road networks was opposite to transportation facilities, which could be related to the connectivity of the road network and traffic congestion conditions, factors that could influence the incidence of CVDs.
This study reveals a high-density aggregation of CVDs and various built environment elements in the southeastern part of the study area, i.e., the urban central area. Through spatial statistical analysis, all examined environmental elements and CVDs showed high Moran's I values, indicating significant clustering in their spatial distribution. Furthermore, the positive spatial correlation between these environmental elements and CVDs corroborates the deep connection between the urban built environment and the incidence of CVDs.
Geodetector analysis reveals significant differences in the impact of different built environment elements on CVDs. Healthcare facilities had the most influence, followed by shopping, dining, and transportation facilities, while parks and road networks had relatively weaker impacts. Notably, the occurrence of CVDs is not only related to individual built environment elements but likely results from the combined effects of multiple elements. Further interaction detection analysis confirmed this hypothesis, finding that the joint impact of any two environmental elements was stronger than any individual element, showing a clear dual-factor enhancement effect. Specifically, the interaction between healthcare and shopping had the most significant impact on the distribution of CVDs, while the combined effect of road networks and parks was the least. By delving into individual factors and their interaction effects, this study reveals a comprehensive view of the impact of the built environment on CVDs, highlighting the complex relationships and differences between environmental elements and the occurrence of diseases.
The GWR model was used to analyze in detail how built environment elements affect CVDs in different regions, aiming to gain a deep understanding of the local effects of the built environment. The research results showed the regression coefficients of built environment elements and their range of variation. Specifically, the regression coefficients for dining exhibited relatively stable trends in spatial distribution. Although the overall impact was moderate, slight fluctuations revealed a slightly enhanced positive correlation in specific areas such as densely commercial or culturally vibrant dining regions. Particularly in the southern and northeastern parts, the combination of diverse dining options and frequent dining consumption patterns showed a slight positive correlation with CVD risk. This reflects the complex impact of dietary habits, food composition, and intake levels on cardiovascular health [ 60 , 61 ].
The regression coefficients for parks and squares showed relatively large fluctuations in spatial distribution, indicating significant regional heterogeneity. This is mainly due to factors such as differences in regional population density and per capita park and square area. In our study, the southeastern region, which is a high-incidence area for CVDs, exhibited negative regression coefficients for parks and squares. This is because this region is the central urban area with a high population density, leading to a significant shortage of per capita green space, thus showing a negative correlation. Conversely, in the northern region, where population distribution is more balanced and parks and squares are more abundant, the per capita green space is relatively sufficient. Therefore, CVD patients have more access to green spaces and exercise areas, showing a positive correlation [ 29 ].
The regression coefficients for shopping consumption showed the smallest fluctuations in spatial distribution. The positive and negative effects were not significantly different, with the positive effects being notably concentrated in the northern, northeastern, and southern commercial thriving areas. Compared to other regions, these areas might have relatively well-developed commercial facilities or superior shopping environments. This could indirectly affect CVD risk through various dimensions, such as physical exertion from walking or cycling during shopping and the regulation of psychological states like satisfaction and pleasure after shopping [ 44 ].
The regression coefficients for transportation facilities showed a significant positive correlation in high-incidence areas of CVDs, with notable fluctuations. This deeply reveals the direct and important impact of traffic conditions, especially congestion and pollution, on cardiovascular health across different regions. In traffic-dense areas such as city centers and transportation hubs, high traffic volume, severe congestion, and increased noise and air pollution collectively pose major threats to residents' cardiovascular health. This not only directly harms the cardiovascular system through accumulated psychological stress and exposure to air pollution but also further exacerbates the risk due to a lack of exercise opportunities [ 62 ].
The regression coefficients for sports and fitness facilities exhibited a high degree of heterogeneity in spatial distribution, showing a significant positive correlation in the southeastern high-incidence area for CVDs, which gradually shifts to a negative correlation towards the outer regions. This deeply reflects the regional differences in the allocation of sports and fitness facilities, residents' exercise habits, and participation rates. In areas with well-developed urban facilities and strong resident awareness of physical activity, the positive effects of sports and fitness activities on cardiovascular health are particularly significant. These activities effectively reduce CVD risk by enhancing physical activity, optimizing cardiopulmonary function, and lowering body fat percentage. However, in areas with relatively scarce sports facilities and poor exercise habits among residents, negative impacts may be observed, highlighting the potential threats to public health due to uneven distribution of sports resources and a lack of exercise culture [ 63 ].
The regression coefficients for healthcare services showed regional differences in spatial distribution. In the northern region, due to the lower population density, the abundance and superior quality of per capita healthcare resources have a significant positive effect on residents' cardiovascular health. In contrast, the southern region, with relatively scarce resources or limited service quality, fails to fully realize the potential benefits of healthcare services. This disparity not only reveals the current uneven distribution of healthcare resources but also emphasizes the importance of enhancing the equalization of healthcare services [ 64 ]. The positive impact of healthcare on CVDs is primarily achieved through efficient prevention, precise diagnosis, and timely treatment. Its effectiveness is influenced by multiple factors, including the sufficiency of medical resources, service quality, residents' healthcare-seeking behavior, medical policies, and technological advancements.
The road network and transportation facilities together constitute the urban transportation system. In the process of transportation planning, we advocate for the continuous optimization of the road network layout, reserving space for future traffic growth, and utilizing intelligent technology to optimize traffic signal management to alleviate congestion. Meanwhile, in the densely populated eastern and southeastern areas, we emphasize enhancing the convenience of public transportation by adding routes and optimizing station locations, making it the preferred mode of travel for residents. Additionally, measures such as the construction of sound barriers and green belts are implemented to effectively reduce noise and air pollution caused by public transportation. Furthermore, we actively promote green travel methods such as cycling and walking by building a comprehensive network of bike lanes and pedestrian paths, thereby promoting public health and environmental protection [ 20 ].
These findings provide a more comprehensive understanding of the complex interactions between built environment elements and CVDs. Therefore, it is essential to balance the integrated impact of these factors in urban planning and public health interventions. Based on a comprehensive analysis of existing research and our study's results, we propose the following viewpoints.
Firstly, healthcare is the primary factor influencing the distribution of CVDs. Living near medical institutions offers substantial benefits to cardiovascular patients, not only enhancing the accessibility of medical services but also helping to quickly respond to emergency medical situations, providing a sense of security for patients. We suggest establishing additional medical centers in the densely populated southeastern region to ensure that community members can easily access high-quality medical services [ 65 ].
Secondly, shopping and dining are the next most important factors affecting the spatial distribution of CVDs. Although the spatial variation of these factors is not significant, their long-term cumulative impact should not be overlooked. We recommend that future urban renewal or renovation efforts reasonably control and plan the density of commercial areas, especially in the eastern region. This requires ensuring that residents can enjoy convenient shopping services to meet their daily needs while avoiding the increased living costs and stress caused by excessive commercial concentration. Additionally, it is necessary to strengthen the management of dining environments, including encouraging dining establishments to offer more healthy food options, such as low-sugar, low-fat, and high-fiber dishes. It is also important to increase the availability of healthy dining options by establishing healthy restaurants and vegetarian eateries, while reasonably controlling and optimizing the layout and number of high-sugar and high-fat food outlets within communities to reduce health risks induced by frequent exposure to such foods [ 66 ].
Road networks and transportation facilities together form the city's transportation system. In transportation planning, we advocate for the continuous optimization of road network layouts, reserving space for future traffic growth, and leveraging intelligent technology to optimize traffic signal management to alleviate congestion. Additionally, enhancing the convenience of public transportation by adding routes and optimizing stops can make it the preferred mode of travel for residents. Complementing this with the construction of sound barriers and green belts can effectively reduce noise and air pollution caused by public transportation. Furthermore, promoting green travel methods such as cycling and walking by building a comprehensive network of cycling lanes and walking paths can foster both health and environmental benefits [ 20 ].
Sports and fitness facilities, along with parks and squares, are essential for improving residents' quality of life and promoting healthy lifestyles. During planning, sports and fitness facilities should be reasonably distributed, especially in the northern part of the study area, to ensure that all communities have convenient access to exercise amenities. Diverse fitness facilities catering to different age groups and exercise needs, such as basketball courts, soccer fields, and fitness equipment zones, should be provided to meet the varied exercise requirements of different groups. Additionally, parks and squares, as crucial spaces for residents' leisure and entertainment, should be planned with a harmonious balance of ecology and landscape. In densely populated and space-constrained southeastern areas, small green spaces, leisure seating, and children's play facilities can be added to provide residents with a pleasant environment for relaxation and nature interaction [ 67 ].
We have explored the mechanisms by which environmental elements impact CVDs and proposed suggestions for optimizing the urban built environment, but this paper still has certain limitations. The impact of the environment on health and disease is complex, and due to time and resource constraints, it was not possible to consider and analyze all potential variables comprehensively, which may have some impact on the research results. To further deepen the study of the relationship between the built environment and cardiovascular health, future research could consider the following aspects: first, expand the scope of research, collecting and analyzing data from different cities and regions to better understand geographical differences in the impact of the built environment on cardiovascular health; second, enhance the scientific nature of the research methods, using more objective and precise methods for data collection and analysis to improve the reliability and accuracy of the research; and finally, deepen the study of the mechanisms between the built environment and cardiovascular health, exploring biological and psychological mechanisms to better understand their relationship.
Focusing on the built-up area of Xixiangtang in Nanning City as the research area, this study delves into the intrinsic connection between the urban built environment and CVDs, uncovering several findings. Utilizing hospital cardiovascular data and urban POI data, and employing spatial analysis techniques such as KDE, spatial autocorrelation analysis, geodetectors, and GWR, we systematically assessed the extent and mechanisms through which various built environment elements impact CVDs. The results show a significant positive correlation between the urban built environment and CVDs. Particularly, healthcare facilities, shopping venues, restaurants, and transportation facilities have significant effects on the incidence and distribution of CVDs. The spatial aggregation of these elements and the dense distribution of CVDs demonstrate significant consistency, further confirming the close link between the built environment and CVDs. Simultaneously, we discovered spatial heterogeneity in the impact of different built environment elements on CVDs. This indicates that in planning and improving the urban environment, elements and areas with a greater impact on CVDs should be considered specifically.
Availability of data and materials
The datasets used or analyzed during the current study are available from the corresponding author upon reasonable request.
Abbreviations
Cardiovascular Disease
Geographically weighted regression
Multiscale geographically weighted regression
The GeoDetector method
OpenStreetMap
Kernel Density Estimation
Points of Interest
Variance Inflation Factor
Application Programming Interface
Roth GA, Mensah GA, Fuster V. The global burden of cardiovascular diseases and risks: a compass for global action. American College of Cardiology Foundation Washington DC; 2020. p. 2980–1.
Masaebi F, Salehi M, Kazemi M, Vahabi N, Azizmohammad Looha M, Zayeri F. Trend analysis of disability adjusted life years due to cardiovascular diseases: results from the global burden of disease study 2019. BMC Public Health. 2021;21:1–13.
Article Google Scholar
Murray CJ, Aravkin AY, Zheng P, Abbafati C, Abbas KM, Abbasi-Kangevari M, et al. Global burden of 87 risk factors in 204 countries and territories, 1990–2019: a systematic analysis for the Global Burden of Disease Study 2019. The lancet. 2020;396(10258):1223–49.
Bloom DE, Cafiero E, Jané-Llopis E, Abrahams-Gessel S, Bloom LR, Fathima S, et al. The global economic burden of noncommunicable diseases. Program on the Global Demography of Aging; 2012.
Xu J, Jing Y, Xu X, Zhang X, Liu Y, He H, et al. Spatial scale analysis for the relationships between the built environment and cardiovascular disease based on multi-source data. Health Place. 2023;83:103048.
Article PubMed Google Scholar
Sarkar C, Webster C, Gallacher J. Are exposures to ready-to-eat food environments associated with type 2 diabetes? A cross-sectional study of 347 551 UK Biobank adult participants. Lancet Planetary Health. 2018;2(10):e438–50.
Grazuleviciene R, Andrusaityte S, Gražulevičius T, Dėdelė A. Neighborhood social and built environment and disparities in the risk of hypertension: A cross-sectional study. Int J Environ Res Public Health. 2020;17(20):7696.
Article PubMed PubMed Central Google Scholar
Ghosh-Dastidar B, Cohen D, Hunter G, Zenk SN, Huang C, Beckman R, et al. Distance to store, food prices, and obesity in urban food deserts. Am J Prev Med. 2014;47(5):587–95.
Braun LM, Rodríguez DA, Evenson KR, Hirsch JA, Moore KA, Roux AVD. Walkability and cardiometabolic risk factors: cross-sectional and longitudinal associations from the multi-ethnic study of atherosclerosis. Health Place. 2016;39:9–17.
Anza-Ramirez C, Lazo M, Zafra-Tanaka JH, Avila-Palencia I, Bilal U, Hernández-Vásquez A, et al. The urban built environment and adult BMI, obesity, and diabetes in Latin American cities. Nat Commun. 2022;13(1):7977.
Article PubMed PubMed Central CAS Google Scholar
Hartig T, Evans GW, Jamner LD, Davis DS, Gärling T. Tracking restoration in natural and urban field settings. J Environ Psychol. 2003;23(2):109–23.
Levy L. Dietary strategies, policy and cardiovascular disease risk reduction in England. Proceedings of the Nutrition Society. 2013;72(4):386–9.
Article PubMed CAS Google Scholar
Dalal HM, Zawada A, Jolly K, Moxham T, Taylor RS. Home based versus centre based cardiac rehabilitation: Cochrane systematic review and meta-analysis. BMJ. 2010;340.
Humpel N, Owen N, Leslie E. Environmental factors associated with adults’ participation in physical activity: a review. Am J Prev Med. 2002;22(3):188–99.
Jia X, Yu Y, Xia W, Masri S, Sami M, Hu Z, et al. Cardiovascular diseases in middle aged and older adults in China: the joint effects and mediation of different types of physical exercise and neighborhood greenness and walkability. Environ Res. 2018;167:175–83.
Murtagh EM, Nichols L, Mohammed MA, Holder R, Nevill AM, Murphy MH. The effect of walking on risk factors for cardiovascular disease: an updated systematic review and meta-analysis of randomised control trials. Prev Med. 2015;72:34–43.
Newby DE, Mannucci PM, Tell GS, Baccarelli AA, Brook RD, Donaldson K, et al. Expert position paper on air pollution and cardiovascular disease. Eur Heart J. 2015;36(2):83–93.
Chum A, O’Campo P. Cross-sectional associations between residential environmental exposures and cardiovascular diseases. BMC Public Health. 2015;15:1–12.
Diener A, Mudu P. How can vegetation protect us from air pollution? A critical review on green spaces’ mitigation abilities for air-borne particles from a public health perspective-with implications for urban planning. Sci Total Environ. 2021;796:148605.
Nieuwenhuijsen MJ. Influence of urban and transport planning and the city environment on cardiovascular disease. Nat Rev Cardiol. 2018;15(7):432–8.
Chandrabose M, den Braver NR, Owen N, Sugiyama T, Hadgraft N. Built environments and cardiovascular health: review and implications. J Cardiopulm Rehabil Prev. 2022;42(6):416–22.
Lee E, Choi J, Lee S, Choi B. P70 Association between built environment and cardiovascular diseases. BMJ Publishing Group Ltd; 2019.
Sallis JF, Floyd MF, Rodríguez DA, Saelens BE. Role of built environments in physical activity, obesity, and cardiovascular disease. Circulation. 2012;125(5):729–37.
Chandrabose M, Rachele JN, Gunn L, Kavanagh A, Owen N, Turrell G, et al. Built environment and cardio-metabolic health: systematic review and meta-analysis of longitudinal studies. Obes Rev. 2019;20(1):41–54.
Ewing R, Cervero R. “Does compact development make people drive less?” The answer is yes. J Am Plann Assoc. 2017;83(1):19–25.
Loo CJ, Greiver M, Aliarzadeh B, Lewis D. Association between neighbourhood walkability and metabolic risk factors influenced by physical activity: a cross-sectional study of adults in Toronto, Canada. BMJ Open. 2017;7(4):e013889.
Dendup T, Feng X, Clingan S, Astell-Burt T. Environmental risk factors for developing type 2 diabetes mellitus: a systematic review. Int J Environ Res Public Health. 2018;15(1):78.
Malambo P, Kengne AP, De Villiers A, Lambert EV, Puoane T. Built environment, selected risk factors and major cardiovascular disease outcomes: a systematic review. PLoS ONE. 2016;11(11):e0166846.
Seo S, Choi S, Kim K, Kim SM, Park SM. Association between urban green space and the risk of cardiovascular disease: A longitudinal study in seven Korean metropolitan areas. Environ Int. 2019;125:51–7.
Yeager RA, Smith TR, Bhatnagar A. Green environments and cardiovascular health. Trends Cardiovasc Med. 2020;30(4):241–6.
Liu M, Meijer P, Lam TM, Timmermans EJ, Grobbee DE, Beulens JW, et al. The built environment and cardiovascular disease: an umbrella review and meta-meta-analysis. Eur J Prev Cardiol. 2023;30(16):1801–27.
Koohsari MJ, McCormack GR, Nakaya T, Oka K. Neighbourhood built environment and cardiovascular disease: knowledge and future directions. Nat Rev Cardiol. 2020;17(5):261–3.
Howell NA, Tu JV, Moineddin R, Chen H, Chu A, Hystad P, et al. Interaction between neighborhood walkability and traffic-related air pollution on hypertension and diabetes: the CANHEART cohort. Environ Int. 2019;132:104799.
Patino JE, Hong A, Duque JC, Rahimi K, Zapata S, Lopera VM. Built environment and mortality risk from cardiovascular disease and diabetes in Medellín, Colombia: An ecological study. Landsc Urban Plan. 2021;213:104126.
Şener R, Türk T. Spatiotemporal analysis of cardiovascular disease mortality with geographical information systems. Appl Spat Anal Policy. 2021;14(4):929–45.
Baptista EA, Queiroz BL. Spatial analysis of cardiovascular mortality and associated factors around the world. BMC Public Health. 2022;22(1):1556.
Lee EY, Choi J, Lee S, Choi BY. Objectively measured built environments and cardiovascular diseases in middle-aged and older Korean adults. Int J Environ Res Public Health. 2021;18(4):1861.
Pourabdollah A, Morley J, Feldman S, Jackson M. Towards an authoritative OpenStreetMap: conflating OSM and OS OpenData national maps’ road network. ISPRS Int J Geo Inf. 2013;2(3):704–28.
Mazidi M, Speakman JR. Association of Fast-Food and Full-Service Restaurant Densities With Mortality From Cardiovascular Disease and Stroke, and the Prevalence of Diabetes Mellitus. J Am Heart Assoc. 2018;7(11):e007651.
Grazuleviciene R, Vencloviene J, Kubilius R, Grizas V, Dedele A, Grazulevicius T, et al. The effect of park and urban environments on coronary artery disease patients: a randomized trial. BioMed Res Int. 2015;2015.
Haralson MK, Sargent RG, Schluchter M. The relationship between knowledge of cardiovascular dietary risk and food shopping behaviors. Am J Prev Med. 1990;6(6):318–22.
Hoevenaar-Blom MP, Wendel-Vos GW, Spijkerman AM, Kromhout D, Verschuren WM. Cycling and sports, but not walking, are associated with 10-year cardiovascular disease incidence: the MORGEN Study. Eur J Prev Cardiol. 2011;18(1):41–7.
Sepehrvand N, Alemayehu W, Kaul P, Pelletier R, Bello AK, Welsh RC, et al. Ambulance use, distance and outcomes in patients with suspected cardiovascular disease: a registry-based geographic information system study. Eur Heart J. 2020;9(1_suppl):45–58.
Google Scholar
Malambo P, De Villiers A, Lambert EV, Puoane T, Kengne AP. The relationship between objectively-measured attributes of the built environment and selected cardiovascular risk factors in a South African urban setting. BMC Public Health. 2018;18:1–9.
Chen W, Liu L, Liang Y. Retail center recognition and spatial aggregating feature analysis of retail formats in Guangzhou based on POI data. Geogr Res. 2016;35(4):703–16.
Feng L, Lei G, Nie Y. Exploring the eco-efficiency of cultivated land utilization and its influencing factors in black soil region of Northeast China under the goal of reducing non-point pollution and net carbon emission. Environmental Earth Sciences. 2023;82(4):94.
Article CAS Google Scholar
Guan Z, Wang T, Zhi X. Temporal-spatial pattern differentiation of traditional villages in central plains economic region. Econ Geogr. 2017;37(9):225–32.
Chen Y. Development and method improvement of spatial autocorrelation theory based on Moran statistics. Geogr Res. 2009;28(6):1449–63.
Pang R, Teng F, Wei Y. A gwr-based study on dynamic mechanism of population urbanization in JIlin province. Sci Geogr Sin. 2014;34:1210–7.
Anselin L, Rey SJ. Modern spatial econometrics in practice: A guide to GeoDa, GeoDaSpace and PySAL. (No Title). 2014.
Zhang Z, Shan B, Lin Q, Chen Y, Yu X. Influence of the spatial distribution pattern of buildings on the distribution of PM2. 5 concentration. Stochastic Environmental Research and Risk Assessment. 2022:1–13.
Dehnad K. Density estimation for statistics and data analysis. Taylor & Francis; 1987.
Wang JF, Li XH, Christakos G, Liao YL, Zhang T, Gu X, et al. Geographical detectors-based health risk assessment and its application in the neural tube defects study of the Heshun Region, China. Int J Geogr Inf Sci. 2010;24(1):107–27.
Shu T, Ren Y, Shen L, Qian Y. Study on spatial heterogeneity of consumption vibrancy and its driving factors in large city: a case of Chengdu City. Urban Development Studies. 2020;27(1):16–21.
Jinfeng W, Chengdong X. Geodetector: Principle and prospective. Acta Geogr Sin. 2017;72(1):116–34.
Feuillet T, Commenges H, Menai M, Salze P, Perchoux C, Reuillon R, et al. A massive geographically weighted regression model of walking-environment relationships. J Transp Geogr. 2018;68:118–29.
Yu H, Gong H, Chen B, Liu K, Gao M. Analysis of the influence of groundwater on land subsidence in Beijing based on the geographical weighted regression (GWR) model. Sci Total Environ. 2020;738:139405.
Anselin L. An introduction to spatial autocorrelation analysis with GeoDa. Spatial Analysis Laboratory: University of Illinois, Champagne-Urbana, Illinois; 2003.
Nicholl J, West J, Goodacre S, Turner J. The relationship between distance to hospital and patient mortality in emergencies: an observational study. Emerg Med J. 2007;24(9):665–8.
Osman AA, Abumanga ZM. The relationship between physical activity status and dietary habits with the risk of cardiovascular diseases. E Journal of Cardiovascular Medicine. 2019;7(2):72.
Shan Z, Li Y, Baden MY, Bhupathiraju SN, Wang DD, Sun Q, et al. Association between healthy eating patterns and risk of cardiovascular disease. JAMA Intern Med. 2020;180(8):1090–100.
Münzel T, Treede H, Hahad O, Daiber A. Too loud to handle? Transportation noise and cardiovascular disease. Can J Cardiol. 2023;39(9):1204–18.
Halonen JI, Stenholm S, Kivimäki M, Pentti J, Subramanian S, Kawachi I, et al. Is change in availability of sports facilities associated with change in physical activity? A prospective cohort study Prev Med. 2015;73:10–4.
PubMed Google Scholar
Wekesah FM, Kyobutungi C, Grobbee DE, Klipstein-Grobusch K. Understanding of and perceptions towards cardiovascular diseases and their risk factors: a qualitative study among residents of urban informal settings in Nairobi. BMJ Open. 2019;9(6):e026852.
Berlin C, Panczak R, Hasler R, Zwahlen M. Do acute myocardial infarction and stroke mortality vary by distance to hospitals in Switzerland? Results from the Swiss National Cohort Study. BMJ Open. 2016;6(11):e013090.
Lim K, Kwan Y, Tan C, Low L, Chua A, Lee W, et al. The association between distance to public amenities and cardiovascular risk factors among lower income Singaporeans. Preventive medicine reports. 2017;8:116–21.
Pereira G, Foster S, Martin K, Christian H, Boruff BJ, Knuiman M, et al. The association between neighborhood greenness and cardiovascular disease: an observational study. BMC Public Health. 2012;12:1–9.
Download references
Acknowledgements
Not appliable.
The General Project of Humanities and Social Sciences Research of the Ministry of Education in 2020: A Study on the Assessment and Planning of Healthy Cities Based on Spatial Data Mining (No. 20YJA630011) and the Natural Resources Digital Industry Academy Construction Project.
Author information
Authors and affiliations.
School of Geographical and Planning, Nanning Normal University, Nanning, 530100, Guangxi, China
Shuguang Deng, Jinlong Liang, Jinhong Su & Shuyan Zhu
School of Architecture, Guangxi Arts University, Nanning, 530009, Guangxi, China
Fatulty of Innovation and Design, City University of Macau, Macau, 999078, China
You can also search for this author in PubMed Google Scholar
Contributions
D.S. Provides research topics, conceptual guidance, translation, paper revision and financial support; L.J. Conceived the framework and wrote the original draft; P.Y. Manuscript checking, chart optimization; L.W. Provided suggestions for revision, and reviewed and edited them; S.J. Is responsible for data acquisition and editing; Z.S. Edits the visual map.
Corresponding author
Correspondence to Jinlong Liang .
Ethics declarations
Ethics approval and consent to participate.
Our study was conducted in accordance with the ethical principles outlined in the Declaration of Helsinki, as well as relevant national and institutional guidelines for human research. The study received approval from the Medical Ethics Committee of Guangxi Zhuang Autonomous Region Nationality Hospital (Approval No.: 2024–65). The de-identified data records from the cardiovascular department that we accessed and analyzed were authorized by Guangxi Nationality Hospital. These data were collected and maintained in compliance with the hospital's patient data management policies and procedures. Given that our study involved only a retrospective analysis of existing medical records, with no direct interaction with patients and no potential for causing any substantial harm, the Medical Ethics Committee of Guangxi Zhuang Autonomous Region Nationality Hospital determined that individual patient informed consent was not required. Nonetheless, we have ensured that all data used in the study were fully anonymized and protected, adhering to the highest standards of confidentiality and privacy.
Consent for publication
Not applicable.
Competing interests
The authors declare no competing interests.
Additional information
Publisher’s note.
Springer Nature remains neutral with regard to jurisdictional claims in published maps and institutional affiliations.
Rights and permissions
Open Access This article is licensed under a Creative Commons Attribution-NonCommercial-NoDerivatives 4.0 International License, which permits any non-commercial use, sharing, distribution and reproduction in any medium or format, as long as you give appropriate credit to the original author(s) and the source, provide a link to the Creative Commons licence, and indicate if you modified the licensed material. You do not have permission under this licence to share adapted material derived from this article or parts of it. The images or other third party material in this article are included in the article’s Creative Commons licence, unless indicated otherwise in a credit line to the material. If material is not included in the article’s Creative Commons licence and your intended use is not permitted by statutory regulation or exceeds the permitted use, you will need to obtain permission directly from the copyright holder. To view a copy of this licence, visit http://creativecommons.org/licenses/by-nc-nd/4.0/ .
Reprints and permissions
About this article
Cite this article.
Deng, S., Liang, J., Peng, Y. et al. Spatial analysis of the impact of urban built environment on cardiovascular diseases: a case study in Xixiangtang, China. BMC Public Health 24 , 2368 (2024). https://doi.org/10.1186/s12889-024-19884-x
Download citation
Received : 27 April 2024
Accepted : 26 August 2024
Published : 31 August 2024
DOI : https://doi.org/10.1186/s12889-024-19884-x
Share this article
Anyone you share the following link with will be able to read this content:
Sorry, a shareable link is not currently available for this article.
Provided by the Springer Nature SharedIt content-sharing initiative
- Built environment
- Impact mechanism
BMC Public Health
ISSN: 1471-2458
- General enquiries: [email protected]
Case Study Questions Class 7 Geography Environment
Case study questions class 7 geography chapter 1 environment.
Answer- Information revolution made communication easier and speedy across the world.
Leave a Reply Cancel reply
We have a strong team of experienced teachers who are here to solve all your exam preparation doubts, case study questions class 7 science acids, bases and salts, up scert solutions class 6 english chapter 7 – the honest woodcutter, ncert solutions class 6 math ganita prakash chapter 3 number play, dav class 6 english reader book solution chapter 5 vacation time.
My Davidson | A Student Blog Research on Populist Presidents Pairs Student With Prof for DRI Project

Intended political science major Cameron Unice ’27 reflects on her summer research with Dr. Bersch examining and comparing how populist presidents exert control over administrative states, including a case study on former President Trump and the Environmental Protection Agency.
About the Author
Cameron Unice ’27 (she/her) is an intended political science major from Richmond, Virginia. On campus, she pole vaults for the Women’s Track & Field Team, writes for The Davidsonian , and is a member of Warner Hall Eating House.
“I chose Davidson because of the high academic standards, the small class sizes and the warm, welcoming atmosphere created by every student and teacher I met!”
My first day of class of my first semester at Davidson, I met Dr. Katherine Bersch in a comparative politics course. I immediately liked her vibe, and she mentioned how she could use some research assistants later in the year. I vividly remember texting my mom about how I wanted to be her assistant… and one semester later, when I ended up in Dr. Bersch’s “Comparative Public Policy” course, she reached out to me and asked if I would be interested in helping her with a project she was working on. She remembered that I had done an individual project focused around deliberative democracy mechanisms, and the research she was conducting centered around similar themes, but in Brazil.
I said yes, and for the next semester, Dr. Bersch and I worked together and I saw her every day as I took both “Comparative Public Policy” and “Intro to Research Methods.” I realized while reading through literature on regulation, bureaucracy, and participation in government that I felt more curious than after the typical assigned readings and felt like the subject matter was somewhat underdeveloped, especially given how much regulation impacts our daily life (around 90% of U.S. laws are rules created by federal agencies, fun fact)!
Dr. Bersch encouraged me to apply for the Davidson Research Initiative, Davidson’s research program that connects professors with students for summer projects. Dr. Bersch told me that she was in the process of writing a book that examines presidential control over the administrative state from a comparative perspective, specifically looking at populist presidents in both Brazil and the United States. She asked if I would want to help her with the U.S. chapter that examines the Environmental Protection Agency under former President Trump. It was a bit of a shot in the dark, as we wrote the application the day that it was due, and I didn’t really have a good idea of what the DRI would even entail. However, Dr. Bersch helped me with the application, and we managed to get it in before the deadline. A few weeks later, we were notified that we were awarded the fellowship!
We wrapped up the semester and started to plan out our summer. The research fellowship entailed that I spend five weeks in person with Dr. Bersch and five weeks working remotely. We set a calendar: I would spend one extra week in Davidson, go home for three, and then spend four weeks in Washington, D.C., where Dr. Bersch was co-directing the Davidson in Washington program . Additionally, I would attend a conference at the University of Pennsylvania, “Regulation in a Changing World,” in June.

Attending the “Regulation in a Changing World" conference at the University of Pennsylvania
Fast forward to D.C.: I stayed in a George Washington University dorm in the Foggy Bottom area of the city, right next to the General Services Administration headquarters and Washington Passport Agency. I didn’t work out of an office, so every day, I would make a goal of finding a new coffee shop to work in, as most of what I did was remote. I would take the metro to a new location, hope and pray I could find an outlet, and sit down for a few hours. Then, I would go through Outlook, LinkedIn, and my Google Calendar, and come up with a plan for the next few hours. Typically, I would have one interview in the day, where I had a document with some broad themes that I could shape my questions around based off of the interviewee’s background.

During Davidson in Washington, our cohort had the chance to meet and hear from Paul Clement, a lawyer and former U.S. Solicitor General who is known for his working aruging many cases before the U.S. Supreme Court.
One of my favorite interviews was with Marcus Peacock, who served as the Deputy Administrator (the number two position) of the EPA in 2008. I especially liked chatting with him because of his background prior to the EPA; he served as the Associate Director of the Natural Resource Programs in the Office of Management and Budget from 2001-2004. In other words, he possessed political knowledge (he served as a presidential appointee as opposed to a career employee) and looked at the EPA with a strong managerial background. He was so enthusiastic in our interview, answered my questions in full, and offered me a different insight into the inner workings of the agency – for example, he explained to me how one of his main roles was to filter only necessary regulation to the Administrator for his approval.
This whole process has been a huge learning opportunity for me, and I’ve seen growth in both my personal and professional life. I’ve gained skills that I wouldn’t get from a typical internship, like learning how to schedule my time when there are no day-to-day goals or manager to report to. Dr. Bersch treated me like a true co-author, meaning that while she obviously offered guidance, I had to offer my own ideas and thoughts as opposed to just helping when I was needed. I’ve learned more people skills this summer than I did in the past few years; knowing how to conduct an interview, how to network at events with scholars and high level government employees, and how to, in no better words, fake it till I make it ! There were a lot of moments where I felt under qualified and out of place, and at first, it was really uncomfortable to push myself out of my comfort zone. However, Dr. Bersch always told me the same thing: act like I’m a published graduate student, and nobody will know the difference. I began to trust myself, make decisions confidently, and walk into interviews with excitement to learn, instead of anxiety to get it right.
Another tidbit I’ve taken from this summer is to reach out to individuals who may seem very busy, unreachable, or too advanced to talk to an undergraduate. Nearly every single EPA employee I reached out to was willing to Zoom with me, or at the very least, exchange a few emails, no matter their status. And they never seemed bothered – they were glad, nearly excited, to talk about their work in the federal government. In a time of high political partisanship and contention, I felt extremely encouraged by the passion that federal employees demonstrated for their work and for how willing they were to compromise and come up with solutions to better the regulations they were publishing.
The 10 week fellowship ended at the beginning of August, but Dr. Bersch and I are still working together to wrap up our research with an article. At the beginning of the summer, we submitted an abstract to the “Structure of Governance Workshop Conference” held in Münster, Germany, this October (again, a bit of a shot in the dark) which was accepted. We will be presenting a draft of our paper, “Deep State versus Deliberative State: The Case of U.S. Environmental Protection Agency” in just a few months! As we dive into writing a research paper, I am excited to see what else I can learn from Dr. Bersch and other public administration scholars.
Scenes from My Summer in Washington, D.C.

- September 5, 2024
- Political Science
- My Davidson
- Skip to main content
- Skip to search
- Skip to footer
Products and Services
Partnerships that make everything possible
A Cisco partnership provides you exclusive benefits like programs and specializations made to reward you, training and enablement that modernize your practice, and opportunities to transform your capabilities and selling motions.
Register as a Cisco partner or affiliate your account
For new companies.
Log in with your Cisco account and register your company as a Cisco partner to gain access to exclusive partner content.
For individuals
Log in with your Cisco account and associate that account with an existing Cisco partner company to gain access to exclusive partner content.
Your profitability is our number 1 goal
Partner Program
A program that is flexibly structured around how you deliver value to customers.
Marketing Velocity
Training to help modernize your marketing approach, customizable campaigns, and access to a top-tier digital community.
Paths to transformation
Explore the possibilities of how Cisco can help you build new capabilities and evolving customer needs.
Cisco partners bring real results
The stadium of the future.
Successful businesses don't always play by the rules. Cisco Partner AmpThink isn’t just playing the game, they’re redefining it—and they’re winning.
Paving the way for others
One of the first members of the African American Cisco Partner Community, TGS is helping to open doors for other black-owned companies.
Find a partner
Partners work to integrate, build, buy, and consult on solutions, software, and services for their customers.
@CiscoPartners
Cisco Partner
Cisco Partners
Partner Blogs
- 0 Shopping Cart
Beast from the East – Extreme weather in the UK
The causes, effects and responses to the Beast from the East
What caused the Beast from the East?
Under normal circumstances, winters in the UK are mild compared to some places on the same latitude because of the jet stream, a warm air mass travelling across the Atlantic Ocean from Mexico to the UK. However, in February 2018, a meteorological event called stratospheric warming disturbed the jet stream – allowing cold winds from Russia to travel as far as the UK.
At this time of year, there is usually a polar vortex – a large mass of cold air – in the upper atmosphere, also known as the stratosphere. This vortex is what usually causes air to move from west to east. However, there was a considerable rise in air temperature of around 50°C 18 miles above the Earth at the North Pole. Sudden stratospheric warming caused a weakening of the jet stream, leading to a change in the direction of the winds approaching the UK from west to east to east to west, allowing a cold air mass (polar continental air mass) from Russia to cover The UK.

Air masses affecting the UK – source: Met Office
When the air left Siberia, Russia, it was around -50°C. By the time it reached the UK, it was just below freezing, though this was still cold for the time of year. In addition, the air mass picked up water over the North Sea, which resulted in a heavy snowfall when it reached The UK.
The Beast from the East meets Storm Emma
Storm Emma was a weather system originating from the Azores and travelling north to the UK. On 1st March 2018, the weather front brought blizzards, gales and sleet as it hit the cold air brought down by the Beast from the East. As a result, the Met Office issued a series of red warnings for southern England. Storm Emma would instead have caused wet and windy conditions without the cold air if temperatures were closer to average.
Primary impacts of the Beast from the East
- Ten people died
- Up to 50cms of snow fell on high ground
- Rural (countryside) areas experienced temperature lows of up to -12°C
Secondary impacts of the Beast from the East
- Hundreds of schools were forced to close
- Thousands of schools were closed across the UK, including more than 125 in North Yorkshire and more than 330 across Kent, and hospital operations were cancelled.
- Many rail services were cancelled.
- British Airways cancelled hundreds of short-haul flights from Heathrow, and London City Airport also cancelled many services.
- The National Grid issued a ‘gas deficit warning’ prompting fears of a shortage, but households were reassured domestic supplies would not be affected.
- Nearly all train operators warned of cancellations and disruption, and hundreds of flights were cancelled.
- Hundreds of motorists on the M80 near Glasgow were stuck for up to 13 hours, with some spending the night in their cars and others abandoning their vehicles. Around 1,000 vehicles were at a standstill, tailing back eight miles in both directions.
- There was a shortage of food in some supermarkets.
- Drifting snow led to the isolation of several villages.
- Red weather warnings were issued covering parts of Scotland, Devon, Somerset, and South Wales, prompting Devon and Cornwall police to declare a major incident. The red weather warning was just the third in seven years.
- The Environment Agency issued flood warnings for parts of Cornwall’s south coast. Residents were told to expect tides to be around 400 mm.
- The Royal Air Force was drafted in to help relief efforts in snow-hit Lincolnshire. Ten RAF vehicles and their crews transported doctors and stranded patients after local police admitted they struggled to cope.
- High on the Pennines on the M62, the military provided support rescuing vehicles.
- In Edinburgh, soldiers were deployed to help transport about 200 NHS clinical and support staff to and from the Western General Hospital and Edinburgh Royal Infirmary.

Premium Resources
Please support internet geography.
If you've found the resources on this page useful please consider making a secure donation via PayPal to support the development of the site. The site is self-funded and your support is really appreciated.
Related Topics
Use the images below to explore related GeoTopics.
Previous Topic Page
Topic home, next topic page, share this:.
- Click to share on Twitter (Opens in new window)
- Click to share on Facebook (Opens in new window)
- Click to share on Pinterest (Opens in new window)
- Click to email a link to a friend (Opens in new window)
- Click to share on WhatsApp (Opens in new window)
- Click to print (Opens in new window)
If you've found the resources on this site useful please consider making a secure donation via PayPal to support the development of the site. The site is self-funded and your support is really appreciated.
Search Internet Geography
Latest Blog Entries
Pin It on Pinterest
- Click to share
- Print Friendly
IMAGES
VIDEO
COMMENTS
Geography Case Studies - A wide selection of geography case studies to support you with GCSE Geography revision, homework and research. X; Facebook; Youtube; 0 Shopping Cart ... The Natural Environment iGCSE Geography. The main types and features of volcanoes; The main features of earthquakes;
Tropical rainforests are often considered to be the "cradles of biodiversity.". Though they cover only about 6% of the Earth's land surface, they are home to over 50% of global biodiversity. Rainforests also take in massive amounts of carbon dioxide and release oxygen through photosynthesis, which has also given them the nickname "lungs ...
Background Information. Location: The earthquake struck 250 miles off the northeastern coast of Japan's Honshu Island at 2:46 pm (local time) on March 11, 2011. Japan 2011 Earthquake map. Magnitude: It measured 9.1 on the Moment Magnitude scale, making it one of the most powerful earthquakes ever recorded. Japan is a highly developed country ...
Alaska Case Study. Alaska is the most northern state in the USA, covering 2 million square kilometres. The southern half experiences relatively mild conditions, whereas a tundra environment overlaying permafrost is found to the north. Alaska is one of the most sparsely populated places on Earth.
A case study: Learning about the climate and landscape in Ontinyent (Spain) ... "The social representation of the rural environment: an analysis of school geography", both presented in 2019 ...
The case studies in this collection, drawn from articles published in Case Studies in the Environment between 2022 and 2023, demonstrate the diverse ways that geographic theories and methods can assist in the analysis of environmental cases, and equip readers with better problem-solving skills.
They evaluate case studies in terms of an area's history, geography, habitats, species, stakeholders, human uses and impacts, and management goals. ... are areas of the marine environment that are protected by laws in order to preserve their natural and cultural resources. In order to establish and manage MPAs, case studies are created.
INTRODUCTION. In the context of global change, biodiversity and ecosystem functions are deteriorating under the pressure of several direct and indirect drivers (IPBES, 2019).In terrestrial and freshwater ecosystems, land-use increase, induced by agriculture, forestry, and urbanization, is the driver with the largest relative impact, while direct exploitation of fish and seafood has the largest ...
Case study of a tropical rainforest setting to illustrate and analyse key themes in water and carbon cycles and their relationship to environmental change and human activity. Amazon Forest The Amazon is the largest tropical rainforest on Earth. It sits within the Amazon River basin, covers some 40% of the South American continent and as you can ...
Climate warming disproportionately impacts countries in the Global South by increasing extreme heat exposure. However, geographic disparities in adaptation capacity are unclear. Here, we assess ...
Geography and Sustainability. Available online 3 September 2024. In Press, ... Cropping pattern optimization considering water shadow price and virtual water flows a case study of Yellow River Basin in China. Agric. Water Manage., 284 (2023), ... Assessing the environmental impacts of freshwater consumption in LCA. Environ. Sci. Technol., 43 ...
By 2007, the Aral Sea shrank to about 10% of its original size and its salinity increased from about 1% dissolved salt to about 10% dissolved salt, which is 3 times more saline than seawater. These changes caused an enormous environmental impact. A once thriving fishing industry is dead as are the 24 species of fish that used to live there; the ...
Ecotourism. Queensland, Australia: Whale watching is a form of ecotourism as it is focused on the natural environment. Ecotourism is often perceived as being 'green' tourism, such as visiting a rainforest. This misses a key issue, which is that ecotourism must be sustainable. Today, ecotourism should be defined as "responsible travel to ...
To get you started, we're giving you a sneak peak of a case study featured in our study guide written by Duncan McCulloch. The full guide, complete with six case studies covering different themes, in-depth syllabus review, and lots of practice questions is available from our. Case study: Environmental strategies to create eco-cities ...
About this series. BERA's Research Ethics Case Studies, edited by Sin Wang Chong and Alison Fox, complement BERA's Ethical Guidelines for Educational Research, fifth edition (2024) by giving concrete examples of how those guidelines can be applied during the research process. Annotations in the margins of each case study document indicate where, among the numbered paragraphs of BERA's ...
Over the total period of the Olympics, some sources suggest "the city brought in around US$3.5 billion in revenues, and spent in excess US$18 billion - a negative balance of $14 billion plus" (Zimbalist, 2015). However, many people feel that the London Games were overall a success, and provided a benefit to the city.
Land use land cover (LULC) changes hugely influence the ecological balance of an ecosystem, which adversely affects the inhabitants, making them more vulnerable to natural calamities. The LULC change studies are therefore carried out to analyze the impact of these changes on the overall ecology of an area and are very helpful in policy framing and proper management of the available natural ...
In 2017 the festival spent over US$8 million with local companies (Glastonbury Festival, 2017a). A 2007 study showed that the average person spent about US$180 on site and roughly the same off-site in the local area (Mendip D.C., 2007). Each year the festival raises US$1.35 million for charities.
The tsunami in 2011 claimed the lives of 15,853 people and injured 6023. The majority of the victims were over the age of 60 (66%). 90% of the deaths was caused by drowning. The remaining 10% died as the result of being crushed in buildings or being burnt. 3282 people were reported missing, presumed dead.
Indoor ice arenas, as large-scale constructions, require sophisticated energy systems to maintain the ice surface within the arena. However, the presence of the ice surface also cools the surrounding spaces, necessitating heating (or cooling) of the seating areas to ensure audience comfort [9], [10].Moreover, due to the typically open layout of ice arenas, energy consumption tends to be high [11].
The built environment, as a critical factor influencing residents' cardiovascular health, has a significant potential impact on the incidence of cardiovascular diseases (CVDs). Taking Xixiangtang District in Nanning City, Guangxi Zhuang Autonomous Region of China as a case study, we utilized the geographic location information of CVD patients, detailed road network data, and urban points of ...
Programs. Gender, Sexuality and Women's Studies; Global Studies; Latin American Studies; Center for Sustainable Communities
The eruption of Eyjafjallajökull in 2010 is a crucial example of how a volcanic event can have local and global impacts. The incident underscored the importance of preparedness, monitoring, and international cooperation in minimizing the effects of such natural disasters. It also highlighted the interconnectedness of our modern world and how a ...
Answer- Human environment reveals the activities, creations and interactions among human beings. CASE STUDY 2 NCERT Class 7 Geography Chapter 1: Lithosphere is the solid crust or the hard top layer of the earth. It is made up of rocks and minerals and covered by a thin layer of soil. It is an irregular surface with various land forms such as ...
Intended political science major Cameron Unice '27 reflects on her summer research with Dr. Bersch examining and comparing how populist presidents exert control over administrative states, including a case study on former President Trump and the Environmental Protections Agency.
The Indus River is one of the longest rivers in the world, originating from the Tibetan Plateau and flowing through China, India, and Pakistan before emptying into the Arabian Sea. The river basin spans four countries: China, India, Afghanistan, and Pakistan, with the majority of its area lying in Pakistan, covering around 70% of the country.
[Federal Register Volume 89, Number 172 (Thursday, September 5, 2024)] [Rules and Regulations] [Pages 72320-72321] From the Federal Register Online via the Government Publishing Office [www.gpo.gov] [FR Doc No: 2024-19868] [[Page 72320]] ----- DEPARTMENT OF HEALTH AND HUMAN SERVICES Food and Drug Administration 21 CFR Part 872 [Docket No. FDA-2024-N-3973] Medical Devices; Dental Devices ...
Partner with Cisco to be agile, relevant, and profitable. Explore programs, incentives, and the benefits of becoming a Cisco partner.
Please Support Internet Geography. If you've found the resources on this site useful please consider making a secure donation via PayPal to support the development of the site. The site is self-funded and your support is really appreciated. Support Internet Geog on Ko-fi. Birmingham Case Study.
The Beast from the East meets Storm Emma. Storm Emma was a weather system originating from the Azores and travelling north to the UK. On 1st March 2018, the weather front brought blizzards, gales and sleet as it hit the cold air brought down by the Beast from the East. As a result, the Met Office issued a series of red warnings for southern ...