Problem Solving: Make a Table Math Strategy

| Add to Folder | |
|---|---|
| creative writing | |
| children's book | |
| activities | |
| classroom tools | |
| language arts and writing | |
| vocabulary |

Math Problem Solving: Make a Table
In this introductory guide, we will explore the Make a Table math strategy, a valuable tool for solving problems by organizing information in a logical format.
This problem-solving strategy encourages students to identify patterns and relationships within data. We’ll explain the strategy using an example and explain how it can be used effectively in mathematical problem-solving.

What is the Make a Table Math Strategy?
Making a table is a math problem-solving strategy that students can use to solve word problems by writing information in a more organized format.
Example of a problem that can be solved by making a table:
Juanita checked a book out of the library, and it is now 7 days overdue. If a book is 1 day overdue, the fine is 10¢, 2 days overdue, 20¢, 3 days overdue, 30¢, and so on. How much is her fine?
Why is the Make a Table Math Strategy Important?
This problem-solving strategy allows students to discover relationships and patterns among data. It encourages students to organize information logically and to look critically at the data to find patterns and develop a solution.
How to Make a Table to Solve a Math Problem
To help you learn to teach the Make a Table Math strategy, we will use the following word problem as an example:
How many hours will a car traveling at 65 miles per hour take to catch up with a car traveling at 55 miles per hour if the slower car starts one hour before the faster car?
Step 1: Understand the Problem
Demonstrate that the first step is understanding the problem. This involves identifying the key pieces of information needed to find the answer. This may require students to read the problem several times or put the problem into their own words.
In this problem, students need to understand that there is a slower car going 55 miles per hour and a faster car going 65 miles per hour. The slower car starts one hour before the faster car. Students need to find how many hours it will take the faster car to catch up to the slower car.
Step 2: Choose a Strategy
Because there are three sets of data to organize, you should use the Make a Table strategy. Generally, if there is data associated with a certain category, it can be organized easily by making a table. This strategy also overlaps with the Find a Pattern strategy because it is often easier to find a pattern when the data is organized in a table.
Step 3: Solve the Problem
Make a table to organize the data. For this example, create a row for the slower car, a row for the faster car, and a column for each hour. Find the distance traveled during each hour by looking at the distances listed in each column.
The distance of the faster car was more than the distance of the slower car in hour seven. The faster car took six hours to catch up to the slower car.
| Slower Car | 55 | 110 | 165 | 220 | 275 | 330 | 385 |
| Faster Car | 0 | 65 | 130 | 195 | 260 | 325 | 390 |
Step 3: Check Your Work
Reread the problem to be sure the question was answered.
Did you find the number of hours it took for the faster car to catch up?
Yes, it took 6 hours.
Check the math to be sure it is correct.
55 x 2 = 110, 55 x 3 = 165, 55 x 4 = 220, 55 x 5 = 275, 55 x 6 = 330, 55 x 7 = 385 65 x 2 = 130, 65 x 3 = 195, 65 x 4 = 260, 65 x 5 = 325, 65 x 6 = 390
Determine if the best strategy was chosen for this problem or if there was another way to solve the problem.
Making a table was a good way to solve this problem.
Step 4: Explain Your Work
The last step is explaining how you found the answer. Demonstrate how to write a paragraph describing the steps you took and how you made decisions throughout the process.
I set up a table for the miles each car had gone during each hour. I kept adding columns until the faster car caught up to the slower car. At the end of the seventh hour, the faster car had gone 390 miles, which was more than the distance traveled by the slower car, 385 miles. Because the faster car didn't start traveling in the first hour, it traveled for six hours.
Step 5: Guided Practice
Have students try solving the following problem using the strategy Make a Table.
The printer in the media center can print 1 page every 30 seconds. The printer in the office can print 4 pages every 30 seconds. If both printers are printing, how many pages will the office printer have printed by the time the media center printer prints 5 pages?
Have students work in pairs, groups, or individually to solve this problem. They should be able to tell or write about how they found the answer and justify their reasoning.
How Can You Stretch Students’ Thinking?
The Make a Table math strategy can be stretched when combined with other strategies, such as looking for patterns or drawing a picture. By combining this strategy with others, students can analyze the data that is given to find more complex relationships.
Featured Middle School Resources

Related Resources
About the author.

Digital Content Manager & Editor
About haley.

- school Campus Bookshelves
- menu_book Bookshelves
- perm_media Learning Objects
- login Login
- how_to_reg Request Instructor Account
- hub Instructor Commons
Margin Size
- Download Page (PDF)
- Download Full Book (PDF)
- Periodic Table
- Physics Constants
- Scientific Calculator
- Reference & Cite
- Tools expand_more
- Readability
selected template will load here
This action is not available.
Module 1: Problem Solving Strategies
- Last updated
- Save as PDF
- Page ID 10352
\( \newcommand{\vecs}[1]{\overset { \scriptstyle \rightharpoonup} {\mathbf{#1}} } \)
\( \newcommand{\vecd}[1]{\overset{-\!-\!\rightharpoonup}{\vphantom{a}\smash {#1}}} \)
\( \newcommand{\id}{\mathrm{id}}\) \( \newcommand{\Span}{\mathrm{span}}\)
( \newcommand{\kernel}{\mathrm{null}\,}\) \( \newcommand{\range}{\mathrm{range}\,}\)
\( \newcommand{\RealPart}{\mathrm{Re}}\) \( \newcommand{\ImaginaryPart}{\mathrm{Im}}\)
\( \newcommand{\Argument}{\mathrm{Arg}}\) \( \newcommand{\norm}[1]{\| #1 \|}\)
\( \newcommand{\inner}[2]{\langle #1, #2 \rangle}\)
\( \newcommand{\Span}{\mathrm{span}}\)
\( \newcommand{\id}{\mathrm{id}}\)
\( \newcommand{\kernel}{\mathrm{null}\,}\)
\( \newcommand{\range}{\mathrm{range}\,}\)
\( \newcommand{\RealPart}{\mathrm{Re}}\)
\( \newcommand{\ImaginaryPart}{\mathrm{Im}}\)
\( \newcommand{\Argument}{\mathrm{Arg}}\)
\( \newcommand{\norm}[1]{\| #1 \|}\)
\( \newcommand{\Span}{\mathrm{span}}\) \( \newcommand{\AA}{\unicode[.8,0]{x212B}}\)
\( \newcommand{\vectorA}[1]{\vec{#1}} % arrow\)
\( \newcommand{\vectorAt}[1]{\vec{\text{#1}}} % arrow\)
\( \newcommand{\vectorB}[1]{\overset { \scriptstyle \rightharpoonup} {\mathbf{#1}} } \)
\( \newcommand{\vectorC}[1]{\textbf{#1}} \)
\( \newcommand{\vectorD}[1]{\overrightarrow{#1}} \)
\( \newcommand{\vectorDt}[1]{\overrightarrow{\text{#1}}} \)
\( \newcommand{\vectE}[1]{\overset{-\!-\!\rightharpoonup}{\vphantom{a}\smash{\mathbf {#1}}}} \)
Unlike exercises, there is never a simple recipe for solving a problem. You can get better and better at solving problems, both by building up your background knowledge and by simply practicing. As you solve more problems (and learn how other people solved them), you learn strategies and techniques that can be useful. But no single strategy works every time.
Pólya’s How to Solve It
George Pólya was a great champion in the field of teaching effective problem solving skills. He was born in Hungary in 1887, received his Ph.D. at the University of Budapest, and was a professor at Stanford University (among other universities). He wrote many mathematical papers along with three books, most famously, “How to Solve it.” Pólya died at the age 98 in 1985.1
1. Image of Pólya by Thane Plambeck from Palo Alto, California (Flickr) [CC BY

In 1945, Pólya published the short book How to Solve It , which gave a four-step method for solving mathematical problems:
First, you have to understand the problem.
After understanding, then make a plan.
Carry out the plan.
Look back on your work. How could it be better?
This is all well and good, but how do you actually do these steps?!?! Steps 1. and 2. are particularly mysterious! How do you “make a plan?” That is where you need some tools in your toolbox, and some experience to draw upon.
Much has been written since 1945 to explain these steps in more detail, but the truth is that they are more art than science. This is where math becomes a creative endeavor (and where it becomes so much fun). We will articulate some useful problem solving strategies, but no such list will ever be complete. This is really just a start to help you on your way. The best way to become a skilled problem solver is to learn the background material well, and then to solve a lot of problems!
Problem Solving Strategy 1 (Guess and Test)
Make a guess and test to see if it satisfies the demands of the problem. If it doesn't, alter the guess appropriately and check again. Keep doing this until you find a solution.
Mr. Jones has a total of 25 chickens and cows on his farm. How many of each does he have if all together there are 76 feet?
Step 1: Understanding the problem
We are given in the problem that there are 25 chickens and cows.
All together there are 76 feet.
Chickens have 2 feet and cows have 4 feet.
We are trying to determine how many cows and how many chickens Mr. Jones has on his farm.
Step 2: Devise a plan
Going to use Guess and test along with making a tab
Many times the strategy below is used with guess and test.
Make a table and look for a pattern:
Procedure: Make a table reflecting the data in the problem. If done in an orderly way, such a table will often reveal patterns and relationships that suggest how the problem can be solved.
Step 3: Carry out the plan:
| Chickens | Cows | Number of chicken feet | Number of cow feet | Total number of feet |
| 20 | 5 | 40 | 20 | 60 |
| 21 | 4 | 42 | 16 | 58 |
Notice we are going in the wrong direction! The total number of feet is decreasing!
| 19 | 6 | 38 | 24 | 62 |
Better! The total number of feet are increasing!
| 15 | 10 | 30 | 40 | 70 |
| 12 | 13 | 24 | 52 | 76 |
Step 4: Looking back:
Check: 12 + 13 = 25 heads
24 + 52 = 76 feet.
We have found the solution to this problem. I could use this strategy when there are a limited number of possible answers and when two items are the same but they have one characteristic that is different.
Videos to watch:
1. Click on this link to see an example of “Guess and Test”
http://www.mathstories.com/strategies.htm
2. Click on this link to see another example of Guess and Test.
http://www.mathinaction.org/problem-solving-strategies.html
Check in question 1:

Place the digits 8, 10, 11, 12, and 13 in the circles to make the sums across and vertically equal 31. (5 points)
Check in question 2:
Old McDonald has 250 chickens and goats in the barnyard. Altogether there are 760 feet . How many of each animal does he have? Make sure you use Polya’s 4 problem solving steps. (12 points)
Problem Solving Strategy 2 (Draw a Picture). Some problems are obviously about a geometric situation, and it is clear you want to draw a picture and mark down all of the given information before you try to solve it. But even for a problem that is not geometric thinking visually can help!
Videos to watch demonstrating how to use "Draw a Picture".
1. Click on this link to see an example of “Draw a Picture”
2. Click on this link to see another example of Draw a Picture.
Problem Solving Strategy 3 ( Using a variable to find the sum of a sequence.)
Gauss's strategy for sequences.
last term = fixed number ( n -1) + first term
The fix number is the the amount each term is increasing or decreasing by. "n" is the number of terms you have. You can use this formula to find the last term in the sequence or the number of terms you have in a sequence.
Ex: 2, 5, 8, ... Find the 200th term.
Last term = 3(200-1) +2
Last term is 599.
To find the sum of a sequence: sum = [(first term + last term) (number of terms)]/ 2
Sum = (2 + 599) (200) then divide by 2
Sum = 60,100
Check in question 3: (10 points)
Find the 320 th term of 7, 10, 13, 16 …
Then find the sum of the first 320 terms.
Problem Solving Strategy 4 (Working Backwards)
This is considered a strategy in many schools. If you are given an answer, and the steps that were taken to arrive at that answer, you should be able to determine the starting point.
Videos to watch demonstrating of “Working Backwards”
https://www.youtube.com/watch?v=5FFWTsMEeJw
Karen is thinking of a number. If you double it, and subtract 7, you obtain 11. What is Karen’s number?
1. We start with 11 and work backwards.
2. The opposite of subtraction is addition. We will add 7 to 11. We are now at 18.
3. The opposite of doubling something is dividing by 2. 18/2 = 9
4. This should be our answer. Looking back:
9 x 2 = 18 -7 = 11
5. We have the right answer.
Check in question 4:
Christina is thinking of a number.
If you multiply her number by 93, add 6, and divide by 3, you obtain 436. What is her number? Solve this problem by working backwards. (5 points)
Problem Solving Strategy 5 (Looking for a Pattern)
Definition: A sequence is a pattern involving an ordered arrangement of numbers.
We first need to find a pattern.
Ask yourself as you search for a pattern – are the numbers growing steadily larger? Steadily smaller? How is each number related?
Example 1: 1, 4, 7, 10, 13…
Find the next 2 numbers. The pattern is each number is increasing by 3. The next two numbers would be 16 and 19.
Example 2: 1, 4, 9, 16 … find the next 2 numbers. It looks like each successive number is increase by the next odd number. 1 + 3 = 4.
So the next number would be
25 + 11 = 36
Example 3: 10, 7, 4, 1, -2… find the next 2 numbers.
In this sequence, the numbers are decreasing by 3. So the next 2 numbers would be -2 -3 = -5
-5 – 3 = -8
Example 4: 1, 2, 4, 8 … find the next two numbers.
This example is a little bit harder. The numbers are increasing but not by a constant. Maybe a factor?
So each number is being multiplied by 2.
16 x 2 = 32
1. Click on this link to see an example of “Looking for a Pattern”
2. Click on this link to see another example of Looking for a Pattern.
Problem Solving Strategy 6 (Make a List)
Example 1 : Can perfect squares end in a 2 or a 3?
List all the squares of the numbers 1 to 20.
1 4 9 16 25 36 49 64 81 100 121 144 169 196 225 256 289 324 361 400.
Now look at the number in the ones digits. Notice they are 0, 1, 4, 5, 6, or 9. Notice none of the perfect squares end in 2, 3, 7, or 8. This list suggests that perfect squares cannot end in a 2, 3, 7 or 8.
How many different amounts of money can you have in your pocket if you have only three coins including only dimes and quarters?
Quarter’s dimes
0 3 30 cents
1 2 45 cents
2 1 60 cents
3 0 75 cents
Videos demonstrating "Make a List"
Check in question 5:
How many ways can you make change for 23 cents using only pennies, nickels, and dimes? (10 points)
Problem Solving Strategy 7 (Solve a Simpler Problem)
Geometric Sequences:
How would we find the nth term?
Solve a simpler problem:
1, 3, 9, 27.
1. To get from 1 to 3 what did we do?
2. To get from 3 to 9 what did we do?
Let’s set up a table:
Term Number what did we do
Looking back: How would you find the nth term?
Find the 10 th term of the above sequence.
Let L = the tenth term
Problem Solving Strategy 8 (Process of Elimination)
This strategy can be used when there is only one possible solution.
I’m thinking of a number.
The number is odd.
It is more than 1 but less than 100.
It is greater than 20.
It is less than 5 times 7.
The sum of the digits is 7.
It is evenly divisible by 5.
a. We know it is an odd number between 1 and 100.
b. It is greater than 20 but less than 35
21, 23, 25, 27, 29, 31, 33, 35. These are the possibilities.
c. The sum of the digits is 7
21 (2+1=3) No 23 (2+3 = 5) No 25 (2 + 5= 7) Yes Using the same process we see there are no other numbers that meet this criteria. Also we notice 25 is divisible by 5. By using the strategy elimination, we have found our answer.
Check in question 6: (8 points)
Jose is thinking of a number.
The number is not odd.
The sum of the digits is divisible by 2.
The number is a multiple of 11.
It is greater than 5 times 4.
It is a multiple of 6
It is less than 7 times 8 +23
What is the number?
Click on this link for a quick review of the problem solving strategies.
https://garyhall.org.uk/maths-problem-solving-strategies.html
Articles & Videos
Problem-solving strategy video: make a table or chart.
- Differentiation
- Games & Activities
- Research & Case Studies
- Product Features
Subscribe to our newsletters
To find out more about how we use your information, please review our Privacy Policy .
Receive teaching resources and tips, exclusive special offers, useful product information and more!
Back to articles & videos
Use this teaching video from iMaths to teach the Problem-Solving Strategy ‘Make a table or chart’. This is one episode from a series of 10 Problem-Solving Strategy videos available at iMaths Online.

Problem-Solving Strategies
There are many different ways to solve a math problem, and equipping students with problem-solving strategies is just as important as teaching computation and algorithms. Problem-solving strategies help students visualize the problem or present the given information in a way that can lead them to the solution. Solving word problems using strategies works great as a number talks activity and helps to revise many skills.
Problem-solving strategies
1. create a diagram/picture, 2. guess and check., 3. make a table or a list., 4. logical reasoning., 5. find a pattern, 6. work backward, 1. create a diagram/draw a picture.
Creating a diagram helps students visualize the problem and reach the solution. A diagram can be a picture with labels, or a representation of the problem with objects that can be manipulated. Role-playing and acting out the problem like a story can help get to the solution.
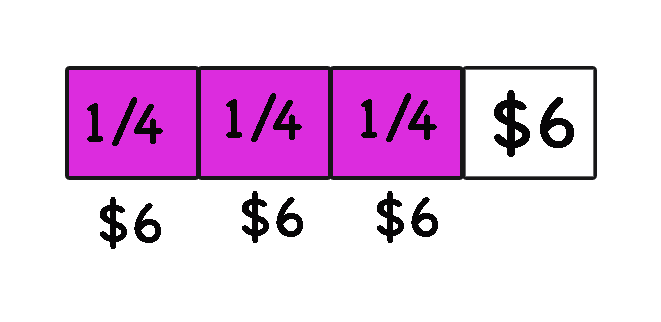
Alice spent 3/4 of her babysitting money on comic books. She is left with $6. How much money did she make from babysitting?
2. Guess and check
Teach students the same strategy research mathematicians use.
With this strategy, students solve problems by making a reasonable guess depending on the information given. Then they check to see if the answer is correct and they improve it accordingly. By repeating this process, a student can arrive at a correct answer that has been checked. It is recommended that the students keep a record of their guesses by making a chart, a table or a list. This is a flexible strategy that works for many types of problems. When students are stuck, guessing and checking helps them start and explore the problem. However, there is a trap. Exactly because it is such a simple strategy to use, some students find it difficult to consider other strategies. As problems get more complicated, other strategies become more important and more effective.
Find two numbers that have sum 11 and product 24.
Try/guess 5 and 6 the product is 30 too high
adjust to 4 and 7 with product 28 still high
adjust again 3 and 8 product 24
3. Make a table or a list
Carefully organize the information on a table or list according to the problem information. It might be a table of numbers, a table with ticks and crosses to solve a logic problem or a list of possible answers. Seeing the given information sorted out on a table or a list will help find patterns and lead to the correct solution.
To make sure you are listing all the information correctly read the problem carefully.
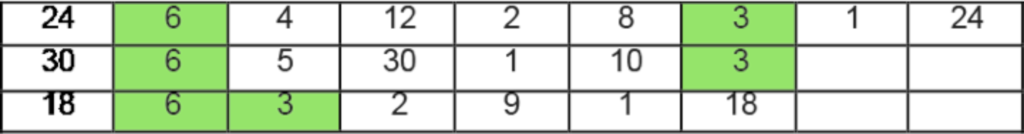
Find the common factors of 24, 30 and 18
Logical reasoning is the process of using logical, systemic steps to arrive at a conclusion based on given facts and mathematic principles. Read and understand the problem. Then find the information that helps you start solving the problem. Continue with each piece of information and write possible answers.
Thomas, Helen, Bill, and Mary have cats that are black, brown, white, or gray. The cats’ names are Buddy, Lucky, Fifi, and Moo. Buddy is brown. Thoma’s cat, Lucky, is not gray. Helen’s cat is white but is not named Moo. The gray cat belongs to Bill. Which cat belongs to each student, and what is its color?
A table or list is useful in solving logic problems.
| Thomas | Lucky | Not gray, the cat is black |
| Helen | Not Moo, not Buddy, not Lucky so Fifi | White |
| Bill | Moo | Gray |
| Mary | Buddy | Brown |
Since Lucky is not gray it can be black or brown. However, Buddy is brown so Lucky has to be black.
Buddy is brown so it cannot be Helen’s cat. Helen’s cat cannot be Moo, Buddy or Lucky, so it is Fifi.
Therefore, Moo is Bill’s cat and Buddy is Mary’s cat.
5. Find a pattern.
Finding a pattern is a strategy in which students look for patterns in the given information in order to solve the problem. When the problem consists of data like numbers or events that are repeated then it can be solved using the “find a pattern” problem-solving strategy. Data can be organized in a table or a list to reveal the pattern and help discover the “rule” of the pattern.
The “rule” can then be used to find the answer to the question and complete the table/list.
Shannon’s Pizzeria made 5 pizzas on Sunday, 10 pizzas on Monday, 20 pizzas on Tuesday, and 40 pizzas on Wednesday. If this pattern continues, how many pizzas will the pizzeria make on Saturday?
| Sunday | 5 |
| Monday | 10 |
| Tuesday | 20 |
| Wednesday | 40 |
| Thursday | |
| Friday | |
| Saturday |
6. Working backward
Problems that can be solved with this strategy are the ones that list a series of events or a sequence of steps .
In this strategy, the students must start with the solution and work back to the beginning. Each operation must be reversed to get back to the beginning. So if working forwards requires addition, when students work backward they will need to subtract. And if they multiply working forwards, they must divide when working backward.
Mom bought a box of candy. Mary took 5 of them, Nick took 4 of them and 31 were given out on Halloween night. The next morning they found 8 pieces of candy in the box. How many candy pieces were in the box when mom bought it.
For this problem, we know that the final number of candy was 8, so if we work backward to “put back” the candy that was taken from the box we can reach the number of candy pieces that were in the box, to begin with.
The candy was taken away so we will normally subtract them. However, to get back to the original number of candy we need to work backward and do the opposite, which is to add them.
8 candy pieces were left + the 31 given out + plus the ones Mary took + the ones Nick took
8+31+5+4= 48 Answer: The box came with 48 pieces of candy.
Selecting the best strategy for a problem comes with practice and often problems will require the use of more than one strategies.
Print and digital activities
I have created a collection of print and digital activity cards and worksheets with word problems (print and google slides) to solve using the strategies above. The collection includes 70 problems (5 challenge ones) and their solution s and explanations.
sample below
How to use the activity cards
Allow the students to use manipulatives to solve the problems. (counters, shapes, lego blocks, Cuisenaire blocks, base 10 blocks, clocks) They can use manipulatives to create a picture and visualize the problem. They can use counters for the guess and check strategy. Discuss which strategy/strategies are better for solving each problem. Discuss the different ways. Use the activities as warm-ups, number talks, initiate discussions, group work, challenge, escape rooms, and more.
Ask your students to write their own problems using the problems in this resource, and more, as examples. Start with a simple type. Students learn a lot when trying to compose a problem. They can share the problem with their partner or the whole class. Make a collection of problems to share with another class.
For the google slides the students can use text boxes to explain their thinking with words, add shapes and lines to create diagrams, and add (insert) tables and diagrams.
Many of the problems can be solved faster by using algebraic expressions. However, since I created this resource for grades 4 and up I chose to show simple conceptual ways of solving the problems using the strategies above. You can suggest different ways of solving the problems based on the grade level.
Find the free and premium versions of the resource below. The premium version includes 70 problems (challenge problems included) and their solutions
There are 2 versions of the resource
70 google slides with explanations + 70 printable task cards
70 google slides with explanations + 11 worksheets
Strategy: Making & Using a Table

Math Problem Solving Strategy: Making and Using a Table to Solve a Problem

This is another free resource for teachers from The Curriculum Corner.
Looking to help your students learn to make a table to solve a problem?
This math problem solving strategy can be practiced with this set of resources.
Math Problem Solving Strategies
This is one in a series of resources to help you focus on specific problem solving strategies in the classroom.
Within this download, we are offering you a range of word problems for practice.
Each page provided contains a single problem solving word problem.
Below each story problem you will find a set of four steps for students to follow when finding the answer.
This set will focus on the make a table strategy for math problem solving.

What are the 4 problem solving steps?
After carefully reading the problem, students will:
- Step 1: Circle the math words.
- Step 2: Ask yourself: Do I understand the problem?
- Step 3: Solve the problem using words and pictures below.
- Step 4: Share the answer along with explaining why the answer makes sense.
Making & Using a Table to Solve Problems
This set of problems assumes children have already had instruction on how to create a table to organize their information.
The problems give them different scenarios and the students have to organize the information in their own tables in order to solve the problems.
If you have students who still need additional support, we have provided pages with the table already added to get them started.
For even more support, you could add some starting information in the table.
As always, we feel its important to differentiate for the needs of individuals or groups in your classrooms.
You can download this set of making and using tables to solve problems practice here:
Problem Solving
You might also be interested in:
- Problem Solving Strategies & Anchor Chart
- Problem Solving Challenge
As with all of our resources, The Curriculum Corner creates these for free classroom use. Our products may not be sold. You may print and copy for your personal classroom use. These are also great for home school families!
You may not modify and resell in any form. Please let us know if you have any questions.
The answer is... Problem Solving Center - The Curriculum Corner 4-5-6
Thursday 30th of January 2020
[…] Making & Using a Table […]
Strategy: Making Change - The Curriculum Corner 4-5-6
Problem Solution Mapping — Everything You Need to Know!
Edraw content team, do you want to make your problem solution mapping.
EdrawMax specializes in diagramming and visualizing. Learn from this article to know everything about what is a problem solution map, problem-solving process, how to make your problem solution map. Just try it free now!
When facing a problem, you have two options. You can either continue untangling the problem in your mind. Or, you can put it all out in a problem-solution map and save time and energy. A problem-solution map helps you find the root cause of the problem. Then, when you know the reasons, you can also find your ultimate solution.
So, let's explore more about problem and solution maps and elements of the problem-solving process in the following guide. We'll also learn about EdrawMax - a free online software to fulfill all your diagramming needs!
So, let's dive into it!

1. What is a Problem Solution Map
A problem solution map represents a logical analysis of available data leading towards a solution. In other words, a problem solution map uses the given data to provide a solution to the problem. A straightforward solution map can have various elements. Typically, it has the following structure:
- a problem statement
- problem definition
- possible causes and effects
- an effective solution
You can change the structure of a solution map according to the problem. However, it should include all the possible laws and principles at all stages to find a practical solution. Solution mapping is crucial and better than thinking about a solution. It's because solution mapping makes you visualize your problem and simplify it.
You consider all the possible reasons behind the problem and milestones to achieve to solve it. As a result, your thoughts become organized and clearer in a visual representation. It also saves your time and effort and increases your productivity.
2. Problem-Solving Process
Practical problem-solving is more than just visualizing and figuring out the solution. It is a process with several steps to guide you to the optimal solution. It includes:
- Problem definition
- Problem analysis
- Possible solutions
- Analysis of the solutions
- Select the best solution
- Execute the solution

Let's explore these!
Problem Definition
Before you start working on your problem solution map, you should define your problem. It might surprise you but defining a problem is more challenging than just writing it on paper. It's because the main problem is often a vague idea merged with unnecessary, distracting conflicts. So, please understand the problem and clear up its confusion.
Problem Analysis
After defining the problem, the next step is to analyze it. When deciding if a solution will truly work, it is vital to recognize where the problem begins, how it fits with the latest advancements, and what the present environment is.
For instance, the following is a problem solution map example. It is a problem tree designed on EdrawMax displaying the causes behind poor health conditions among Gapachi Vileans. You can tell a problem's roots from its consequences (branches) by comparing them to a tree (trunk).

Possible Solutions
In this step, you should focus on solutions. However, it is essential to come up with as many solutions as possible without evaluating them. You should consider it a solution, even if it seems vague. So, think for some time and list all the ideas that come to mind as solutions to the problem.
Analysis of the Solutions
Here, you will go back to all the solutions you wrote in the previous step. Then, you will consider each idea individually and investigate it. When analyzing an argument, assess its positive and negative aspects and whether it addresses the problem entirely. You can also write unique benefits of each idea to differentiate it from others.
For example, consider this Graphic Organizer: Problem Solution diagram by EdrawMax. It simplifies finding a solution as you can write all the possible choices and their pros and cons. Then, you can select the most effective solution as the final one.

Select the Best Solution
After writing the pros and cons of all the ideas side by side, you need to filter the best solutions from the list. You can also improve it by revising the ideas and refining their individual traits. In the end, you might have one or more solutions (the best ones!). If not, consider reevaluating the problem statement or repeating the 3rd and 4rth steps.
Execute the Solution
Once you have come up with the solution, the final step is to execute it. Then, consider what you should do next to follow that particular solution. In other words, you need to plan your solution to solve the problem.
3. Visualize Your Problem Solution Map Process
The best thing about a solution map is that it is open-ended. However, it also means no hard and fast rule or rocket science behind creating a solution map .
Still, creating a problem and solution map from scratch takes a lot of work. The good thing is that you can always take advantage of powerful software like EdrawMax . It is an incredibly powerful online service to tackle all your diagramming needs.

EdrawMax has all the features you need to visualize your problem-solution map. For instance:
- You can insert tables, charts, timelines - anything that can help define and analyze the problem and/or solutions.
- You can add, remove, replace, and do much more with symbols and shapes through Predefine Libraries in EdrawMax.
- You can use the Connector feature and drag it to draw a line (arrows) to a connection point on the shape you want to connect to.
- You can edit color, line weight, dash style, and arrow style using the Line or Line Style feature to customize your solution map.
What else? You can also find hundreds of ready-made solution map templates on the EdrawMax community. These editable templates make everything easy, as you can edit them according to your preference. Creating a solution map from scratch takes less time and effort.
4. Conclusion
Every problem has a solution, but finding that solution can be challenging. The road map to finding the ultimate solution is often chaotic and messy. With a problem and solution map , you can visualize your problem, its root causes, and possible solutions. A problem solution map is a way to analyze the available data and find the perfect solution to solve the problem. With EdrawMax , you can easily create your problem solution map. Or you can also save time by editing an already published template on the EdrawMax community!
You May Also Like
Hierarchy organizational chart complete guide, modern organizational chart complete guide, it organization chart complete guide, matrix org chart complete guide, product organization structure complete guide, accounting flowchart complete guide.

Problem-solving flowchart: A visual method to find perfect solutions
Reading time: about 7 min
“People ask me questions Lost in confusion Well, I tell them there's no problem Only solutions” —John Lennon, “Watching the Wheels”
Despite John Lennon’s lyrics, nobody is free from problems, and that’s especially true in business. Chances are that you encounter some kind of problem at work nearly every day, and maybe you’ve had to “put out a fire” before lunchtime once or twice in your career.
But perhaps what Lennon’s saying is that, no matter what comes our way, we can find solutions. How do you approach problems? Do you have a process in place to ensure that you and your co-workers come to the right solution?
In this article, we will give you some tips on how to find solutions visually through a problem-solving flowchart and other methods.
What is visual problem-solving?
If you are a literal thinker, you may think that visual problem-solving is something that your ophthalmologist does when your vision is blurry. For the rest of us, visual problem-solving involves executing the following steps in a visual way:
- Define the problem.
- Brainstorm solutions.
- Pick a solution.
- Implement solutions.
- Review the results.
How to make your problem-solving process more visual
Words pack a lot of power and are very important to how we communicate on a daily basis. Using words alone, you can brainstorm, organize data, identify problems, and come up with possible solutions. The way you write your ideas may make sense to you, but it may not be as easy for other team members to follow.
When you use flowcharts, diagrams, mind maps, and other visuals, the information is easier to digest. Your eyes dart around the page quickly gathering information, more fully engaging your brain to find patterns and make sense of the data.
Identify the problem with mind maps
So you know there is a problem that needs to be solved. Do you know what that problem is? Is there only one problem? Is the problem sum total of a bunch of smaller problems?
You need to ask these kinds of questions to be sure that you are working on the root of the issue. You don’t want to spend too much time and energy solving the wrong problem.
To help you identify the problem, use a mind map. Mind maps can help you visually brainstorm and collect ideas without a strict organization or structure. A mind map more closely aligns with the way a lot of our brains work—participants can bounce from one thought to the next defining the relationships as they go.
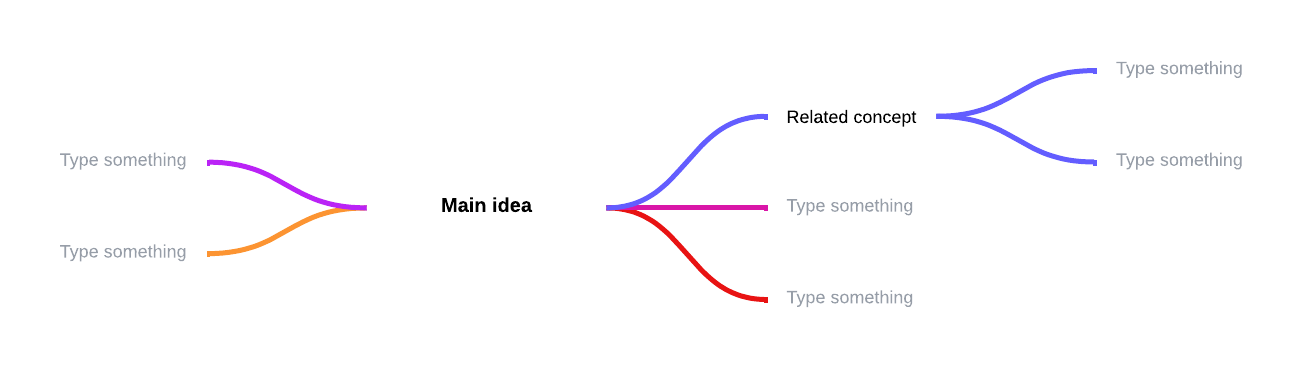
Mind mapping to solve a problem includes, but is not limited to, these relatively easy steps:
- In the center of the page, add your main idea or concept (in this case, the problem).
- Branch out from the center with possible root causes of the issue. Connect each cause to the central idea.
- Branch out from each of the subtopics with examples or additional details about the possible cause. As you add more information, make sure you are keeping the most important ideas closer to the main idea in the center.
- Use Collaborative AI to generate or expand on your ideas, so your mind map is as complete as possible.
Alternatively, you could use mind maps to brainstorm solutions once you discover the root cause. Try our free mind map template or add the mind map shape library to quickly start your own mind map.
Create a problem-solving flowchart
A mind map is generally a good tool for non-linear thinkers. However, if you are a linear thinker—a person who thinks in terms of step-by-step progression making a flowchart may work better for your problem-solving strategy. A flowchart is a graphical representation of a workflow or process with various shapes connected by arrows representing each step.
Whether you are trying to solve a simple or complex problem, the steps you take to solve that problem with a flowchart are easy and straightforward. Using boxes and other shapes to represent steps, you connect the shapes with arrows that will take you down different paths until you find the logical solution at the end.

Flowcharts or decision trees are best used to solve problems or answer questions that are likely to come up multiple times. For example, Yoder Lumber , a family-owned hardwood manufacturer, built decision trees in Lucidchart to demonstrate what employees should do in the case of an injury.
To start your problem-solving flowchart, follow these steps:
- Draw a starting shape to state your problem.
- Draw a decision shape where you can ask questions that will give you yes-or-no answers.
- Based on the yes-or-no answers, draw arrows connecting the possible paths you can take to work through the steps and individual processes.
- Continue following paths and asking questions until you reach a logical solution to the stated problem.
- Try the solution. If it works, you’re done. If it doesn’t work, review the flowchart to analyze what may have gone wrong and rework the flowchart until you find the solution that works.
If your problem involves a process or workflow , you can also use flowcharts to visualize the current state of your process to find the bottleneck or problem that’s costing your company time and money.

Lucidchart has a large library of flowchart templates to help you analyze, design, and document problem-solving processes or any other type of procedure you can think of.
Draw a cause-and-effect diagram
A cause-and-effect diagram is used to analyze the relationship between an event or problem and the reason it happened. There is not always just one underlying cause of a problem, so this visual method can help you think through different potential causes and pinpoint the actual cause of a stated problem.
Cause-and-effect diagrams, created by Kaoru Ishikawa, are also known as Ishikawa diagrams, fishbone diagrams , or herringbone diagrams (because they resemble a fishbone when completed). By organizing causes and effects into smaller categories, these diagrams can be used to examine why things went wrong or might go wrong.

To perform a cause-and-effect analysis, follow these steps.
1. Start with a problem statement.
The problem statement is usually placed in a box or another shape at the far right of your page. Draw a horizontal line, called a “spine” or “backbone,” along the center of the page pointing to your problem statement.
2. Add the categories that represent possible causes.
For example, the category “Materials” may contain causes such as “poor quality,” “too expensive,” and “low inventory.” Draw angled lines (or “bones”) that branch out from the spine to these categories.
3. Add causes to each category.
Draw as many branches as you need to brainstorm the causes that belong in each category.
Like all visuals and diagrams, a cause-and-effect diagram can be as simple or as complex as you need it to be to help you analyze operations and other factors to identify causes related to undesired effects.
Collaborate with Lucidchart
You may have superior problem-solving skills, but that does not mean that you have to solve problems alone. The visual strategies above can help you engage the rest of your team. The more involved the team is in the creation of your visual problem-solving narrative, the more willing they will be to take ownership of the process and the more invested they will be in its outcome.
In Lucidchart, you can simply share the documents with the team members you want to be involved in the problem-solving process. It doesn’t matter where these people are located because Lucidchart documents can be accessed at any time from anywhere in the world.
Whatever method you decide to use to solve problems, work with Lucidchart to create the documents you need. Sign up for a free account today and start diagramming in minutes.
About Lucidchart
Lucidchart, a cloud-based intelligent diagramming application, is a core component of Lucid Software's Visual Collaboration Suite. This intuitive, cloud-based solution empowers teams to collaborate in real-time to build flowcharts, mockups, UML diagrams, customer journey maps, and more. Lucidchart propels teams forward to build the future faster. Lucid is proud to serve top businesses around the world, including customers such as Google, GE, and NBC Universal, and 99% of the Fortune 500. Lucid partners with industry leaders, including Google, Atlassian, and Microsoft. Since its founding, Lucid has received numerous awards for its products, business, and workplace culture. For more information, visit lucidchart.com.
Related articles
How you can use creative problem solving at work.
Sometimes you're faced with challenges that traditional problem solving can't fix. Creative problem solving encourages you to find new, creative ways of thinking that can help you overcome the issue at hand more quickly.
Dialogue mapping 101: How to solve problems through visuals
Dialogue mapping is a facilitation technique used to visualize critical thinking as a group. Learn how you and your team can start dialogue mapping today to solve problems and bridge gaps in knowledge and understanding (plus get a free template!).
Bring your bright ideas to life.
or continue with
By registering, you agree to our Terms of Service and you acknowledge that you have read and understand our Privacy Policy .
- + ACCUPLACER Mathematics
- + ACT Mathematics
- + AFOQT Mathematics
- + ALEKS Tests
- + ASVAB Mathematics
- + ATI TEAS Math Tests
- + Common Core Math
- + DAT Math Tests
- + FSA Tests
- + FTCE Math
- + GED Mathematics
- + Georgia Milestones Assessment
- + GRE Quantitative Reasoning
- + HiSET Math Exam
- + HSPT Math
- + ISEE Mathematics
- + PARCC Tests
- + Praxis Math
- + PSAT Math Tests
- + PSSA Tests
- + SAT Math Tests
- + SBAC Tests
- + SIFT Math
- + SSAT Math Tests
- + STAAR Tests
- + TABE Tests
- + TASC Math
- + TSI Mathematics
- + ACT Math Worksheets
- + Accuplacer Math Worksheets
- + AFOQT Math Worksheets
- + ALEKS Math Worksheets
- + ASVAB Math Worksheets
- + ATI TEAS 6 Math Worksheets
- + FTCE General Math Worksheets
- + GED Math Worksheets
- + 3rd Grade Mathematics Worksheets
- + 4th Grade Mathematics Worksheets
- + 5th Grade Mathematics Worksheets
- + 6th Grade Math Worksheets
- + 7th Grade Mathematics Worksheets
- + 8th Grade Mathematics Worksheets
- + 9th Grade Math Worksheets
- + HiSET Math Worksheets
- + HSPT Math Worksheets
- + ISEE Middle-Level Math Worksheets
- + PERT Math Worksheets
- + Praxis Math Worksheets
- + PSAT Math Worksheets
- + SAT Math Worksheets
- + SIFT Math Worksheets
- + SSAT Middle Level Math Worksheets
- + 7th Grade STAAR Math Worksheets
- + 8th Grade STAAR Math Worksheets
- + THEA Math Worksheets
- + TABE Math Worksheets
- + TASC Math Worksheets
- + TSI Math Worksheets
- + AFOQT Math Course
- + ALEKS Math Course
- + ASVAB Math Course
- + ATI TEAS 6 Math Course
- + CHSPE Math Course
- + FTCE General Knowledge Course
- + GED Math Course
- + HiSET Math Course
- + HSPT Math Course
- + ISEE Upper Level Math Course
- + SHSAT Math Course
- + SSAT Upper-Level Math Course
- + PERT Math Course
- + Praxis Core Math Course
- + SIFT Math Course
- + 8th Grade STAAR Math Course
- + TABE Math Course
- + TASC Math Course
- + TSI Math Course
- + Number Properties Puzzles
- + Algebra Puzzles
- + Geometry Puzzles
- + Intelligent Math Puzzles
- + Ratio, Proportion & Percentages Puzzles
- + Other Math Puzzles
How to Solve Word Problems Involving Completing a Table and Making a Graph?
Word problems involving completing a table and making a graph typically require you to use given information to fill in a table or chart, and then use that data to create a graph. These types of problems often involve real-world situations, such as sales data, population growth, or weather patterns.

A Step-by-step Guide to Solve Word Problems Involving Completing a Table and Making a Graph
To solve these problems, you will need to carefully read and understand the given information, identify the variables that need to be tracked and plotted, and use mathematical operations to calculate missing data points.
You will then need to use this information to create a graph that accurately represents the data and highlights any important trends or patterns.
For example, a word problem involving completing a table and making a graph might ask you to analyze the sales data for a particular product over the course of a year.
You would need to fill in a table with the sales figures for each month, calculate the total sales for the year, and then use this information to create a graph that shows the monthly sales trends and highlights any spikes or dips in sales.
Overall, these types of problems require you to use your mathematical and analytical skills to interpret and represent data in a clear and meaningful way.
Word Problems Involving Completing a Table and Making a Graph – Examples 1
Jennifer is starting a new business selling handmade soap. She wants to keep track of her sales for the first \(4\) months. She must be able to sell \(100\) soap per month. Complete the table and graph the data from the table.
| Month | Total Soaps Sold |
| \(1\) | ______________ |
| \(2\) | ______________ |
| \(3\) | ______________ |
| \(4\) | ______________ |
Figure out the total soaps sold after one month: \(1=100\). After two months: \(2=200\), three months: \(3=300\) and four months: \(4=400\). Utilize the table to write down ordered pairs of numbers. For each pair, write down the number of months first and then the total number of soaps sold, \((1,100),(2,200),(3,300),(4,400)\). Then, graph the ordered pairs. Begin with the first pair, \((1,100)\).
| Month | Total Soaps Sold |
| \(1\) | \(100\) |
| \(2\) | \(200\) |
| \(3\) | \(300\) |
| \(4\) | \(400\) |
Now create a graph according to the table:
by: Effortless Math Team about 1 year ago (category: Articles )
Effortless Math Team
Related to this article, more math articles.
- How to Graph Trigonometric Functions?
- Ratio, Proportion and Percentages Puzzle -Critical Thinking 9
- How to Divide Polynomials Using Long Division?
- The Best Strategies For Successful Math Tutoring Online
- How to Solve Real-World Puzzles: Division with Decimal Quotients
- 7th Grade Ohio’s State Tests Math Worksheets: FREE & Printable
- How to Solve Compound Inequalities
- The Ultimate 7th Grade GMAS Math Course (+FREE Worksheets)
- Accuplacer Math Formulas
- 8th Grade STAAR Math FREE Sample Practice Questions
What people say about "How to Solve Word Problems Involving Completing a Table and Making a Graph? - Effortless Math: We Help Students Learn to LOVE Mathematics"?
No one replied yet.
Leave a Reply Cancel reply
You must be logged in to post a comment.
Mastering Grade 6 Math Word Problems The Ultimate Guide to Tackling 6th Grade Math Word Problems
Mastering grade 5 math word problems the ultimate guide to tackling 5th grade math word problems, mastering grade 7 math word problems the ultimate guide to tackling 7th grade math word problems, mastering grade 2 math word problems the ultimate guide to tackling 2nd grade math word problems, mastering grade 8 math word problems the ultimate guide to tackling 8th grade math word problems, mastering grade 4 math word problems the ultimate guide to tackling 4th grade math word problems, mastering grade 3 math word problems the ultimate guide to tackling 3rd grade math word problems.
- ATI TEAS 6 Math
- ISEE Upper Level Math
- SSAT Upper-Level Math
- Praxis Core Math
- 8th Grade STAAR Math
Limited time only!
Save Over 45 %
It was $89.99 now it is $49.99
Login and use all of our services.
Effortless Math services are waiting for you. login faster!
Register Fast!
Password will be generated automatically and sent to your email.
After registration you can change your password if you want.
- Math Worksheets
- Math Courses
- Math Topics
- Math Puzzles
- Math eBooks
- GED Math Books
- HiSET Math Books
- ACT Math Books
- ISEE Math Books
- ACCUPLACER Books
- Premium Membership
- Youtube Videos
Effortless Math provides unofficial test prep products for a variety of tests and exams. All trademarks are property of their respective trademark owners.
- Bulk Orders
- Refund Policy
Polya's Problem Solving Process | Overview & Steps
Anita Dunn graduated from Saint Mary's College with a Bachelor's of Science in Mathematics, and graduated from Purdue University with a Master's of Science in Mathematics. She has been certified as a Developmental Education Specialist through the Kellogg Institute. She has more than 10 years of experience as a college professor.
Maria has taught University level psychology and mathematics courses for over 20 years. They have a Doctorate in Education from Nova Southeastern University, a Master of Arts in Human Factors Psychology from George Mason University and a Bachelor of Arts in Psychology from Flagler College.
Kathryn has taught high school or university mathematics for over 10 years. She has a Ph.D. in Applied Mathematics from the University of Wisconsin-Milwaukee, an M.S. in Mathematics from Florida State University, and a B.S. in Mathematics from the University of Wisconsin-Madison.
Additional Example of Using Polya's Four-Step Problem-Solving Process
In the following example, use Polya's Four-Step Problem-Solving Process as outlined in the video lesson. Be sure to execute each step of the process and to state what that step involves.
Farmer Brown has many animals on his farm. He has 72 chickens, which make up 60% of his total animals, and the rest of his animals are sheep. How many legs in total do his animals have?
1) Step One of Polya's Process is to understand the problem. We are trying to count how many legs the animals have in total. The animals are chickens (which have 2 legs each) and sheep (which have 4 legs each).
2) Step Two of Polya's Process is to devise a plan. We will work with an equation. An example of an equation to use to solve the problem is (72 chickens * 2 legs) + (number of sheep * 4 legs) = total legs. However, we do not know the number of sheep. We know that 60% of the total number of animals is equal to 72, so if n is the total number of animals, we have 0.60n = 72 so the total number of animals is 72/0.6 = 120. Then the number of sheep is the remaining amount of animals. A revised equation to use to solve the problem is (72 chickens * 2 legs) + ((120-72) sheep * 4 legs) = total legs.
3) Step Three is to carry out the plan. We will solve our equation. 120 - 72 = 48 sheep, and so we have (72 * 2) + (48 * 4) = total legs. 72 * 2 = 144 and 48 * 4 = 192, so the total number of legs is 144+192 = 336 legs.
4) Step Four is to look back. Does this answer make sense? There should be more legs than animals and the number should be an even number (the animals each have an even number of legs) and 336 fits this. We can check that 0.6(120) = 72 chickens and that 0.4(120) = 48 to make sure the number of animals is correct. Our answer checks out.
How can Polya's Four-Step Problem-Solving Process help you solve problems?
Guide to Discussion
This is a pretty open-ended question - something that may help guide students on their discussion is to talk about word problems in math class. For many students, the hardest part of word problems is finding out what is even being asked and translating it into an equation - Polya's process helps with these things.
What is Polya's 4 steps in problem solving?
Polya's four step method for problem solving is
1) Understand the Problem-Make sure you understand what the question is asking and what information will be used to solve the problem.
2) Devise a Plan-Figure out what method you will use to solve the problem.
3) Carry out the Plan-Use that method to solve the problem
4) Look Back-Double check your answer and make sure it is reasonable.
What made George Polya famous?
George Polya's book: "How to Solve it" sold over a million copies and has been translated into at least 21 different languages. He is most famous for his "four step problem solving process" which helps students solve word problems.
What is Polya's first principle for solving problems?
Polya's first principle for solving problems is arguably one of the most important steps: Understand the Problem. You first need to make sure you understand any vocabulary words, understand what the problem is asking for, and understand what information is given in the problem which will help you solve it.
Table of Contents
Polya's problem solving process, how to solve using polya's method, lesson summary.
George Polya (1887-1985) was born in Hungary. He received his Ph.D. in mathematics at the University of Budapest. For many years he served as a professor at the Swiss Federal Institute of Technology in Zurich. Then, in 1940, Dr. Polya moved to the United States where he taught briefly at Brown University, and then he moved to Stanford University.
Dr. Polya maintained a lifelong interest in the thought processes we use when we solve math problems. Dr. Polya wrote many books, including How to Solve It (1945). This book sold over a million copies in at least 21 different languages. His methods are now commonly used amongst students when solving word problems. (Long et al., 2015)
His four step process can be summarized by
- Understand the Problem
Devise a Plan
- Carry out the Play
Understand the problem
Are there any vocabulary words you don't understand within the problem? If so, it'd be a good idea to look them up.
Figure out what you are being asked to find.
Can you restate the problem in your own words?
Would a diagram or a picture help you to solve the problem? If so, draw it.
Do you have enough information to solve the problem? Is there information included which you don't need?
Example: Isaac has 5 apples and he has 10 friends. He wants to give 2 apples to each of his friends. How many apples does he need to buy?
For the "understand the problem" step, we want to decide what we are being asked to find. Thankfully, the last sentence tells us. We want to find out "how many apples does he need to buy?" In other words, how many more apples does he need.
Do we have enough information? We know that he has 5 apples already. He has 10 friends. He wants to give two apples to each of his friends. That should give us the ability to solve this problem.
Decide how you are going to try to solve your problem. You could use any of the following methods:
- use algebra
- use basic arithmetic
- look for a pattern
- guess and check ...guess an answer, see if it works. If it doesn't work, try something else.
- use a model or a diagram...sometimes just by drawing a model we can figure out the answer.
- use a formula
Or, something else! There are many methods we could use here. Be creative!
For our earlier example, we can answer this question a few different ways. We could draw out 10 picture of people. Then we can draw two apples per friend, and count out how many Isaac currently has and count how many he needs.
If we had a classroom of children, we could have ten of them stand up and hand out 5 apples. Then we could figure out how many more apples we need to make sure each child has two apples. Hint: The kids could hold out their empty hands, so the other children could count how many more apples are needed.
We could use a bit of arithmetic, finding out how many apples he needs for all of his friends and subtracting to find out how many more he needs.
To solve my example problem, I'm going to use arithmetic.
Carry out the Plan
This is where we do the math and figure out our answer! Whatever you decided your plan was earlier.
Back to my example problem: we know that Isaac has 10 friends and each friend needs two apples. We can multiply {eq}2*10=20 {/eq}
So Isaac needs 20 apples. He currently has 5 apples. Therefore we can subtract {eq}20 - 5 = 15 {/eq}
Therefore Isaac needs 15 more apples. This is how many he will be buying.
This is the step everyone wants to skip. And yet it is also one of the most important steps. Basically, you will be checking your answer and thinking about whether or not your answer makes sense.
- Is there another way I could solve this problem?
- Does my answer make sense?
- Are there similar problems that I could use this strategy on? This will help you later on as you complete more problems.
Thinking about my example problem: Does the answer make sense? Yes, 15 apples is a reasonable number of apples, considering we started with 5 apples and we needed 2 apples per person for 10 people.
I can take a quick look at my arithmetic and make sure I didn't make a simple mistake. Sometimes it's even a good idea to completely redo the problem, it is sometimes easier to find a mistake this way.
Can I solve this problem some other way? I could also draw out a picture to see if the answer is correct. It doesn't have to be fancy, some stick figures for the friends and circles for the apples works just fine. We could color in 5 of the circles to show that Isaac currently has those apples, and then count the rest.
To unlock this lesson you must be a Study.com Member. Create your account

An error occurred trying to load this video.
Try refreshing the page, or contact customer support.
You must c C reate an account to continue watching
Register to view this lesson.
As a member, you'll also get unlimited access to over 88,000 lessons in math, English, science, history, and more. Plus, get practice tests, quizzes, and personalized coaching to help you succeed.
Get unlimited access to over 88,000 lessons.
Already registered? Log in here for access
Resources created by teachers for teachers.
I would definitely recommend Study.com to my colleagues. It’s like a teacher waved a magic wand and did the work for me. I feel like it’s a lifeline.
You're on a roll. Keep up the good work!
Just checking in. are you still watching.
- 0:32 Understanding the Problem
- 1:47 Devise a Plan
- 2:32 Carry out the Plan
- 3:33 Look Back
- 5:04 Example
- 6:56 Lesson Summary
Let's try this method with another example problem.
Two trains leave the train station at the same time. They are going in opposite directions. One train is going 60 miles an hour, while the other train is going 50 miles an hour. In two hours, how far apart are the trains?
Understand the problem:
What is the question asking us? It is asking us how far apart the trains are after 2 hours.
What information is important here? The trains leave the station at the same time. They are going in opposite directions. One has a rate of 60 miles an hour, the other has a rate of 50 miles an hour.
We are finding the distance given the rate and the time, so we should remember the distance formula: {eq}d=r*t {/eq}
A diagram may help us:
Make a plan:
How are we going to solve this problem. We could label the diagram and show how far each of the trains have traveled away from the train station after two hours. We could use arithmetic. We could make a formula and solve it for 2 hours.
Carry out the plan:
Let's make a formula!
First we need to define the variables that we will use.
We want to know the distance between the trains, so let d= distance between the trains.
We know that the distance is going to depend on the amount of time, so let's let t=time since the trains departed the station.
We also know that d=r*t, and that the trains are moving away from each other, so the total distance between the two trains will be found by adding the distance the first train has traveled and the distance the second train has traveled.
This gives us the following formula: {eq}d=60t+50t {/eq}
We want to know the distance between the trains after two hours, so let {eq}t=2 {/eq}
And we get {eq}d=60*2+50*2 = 120 + 100 = 220 {/eq}
So, our answer is that after 2 hours, the trains will be 220 miles apart.
Does the answer make sense? Yes, 220 miles is a reasonable distance between two trains moving farther apart after two hours.
Could we do it a different way? Yes. We could find out the distance the first train moves after two hours: 120 miles, and the distance the second train moves after 2 hours: 100 miles, and then add them together to get 220 miles.
Polya's problem-solving process is a systematic method to solve a mathematical problem. By following each step, students are more likely to be able to solve the problem correctly.
Video Transcript
Polya's 4-step process.
George Polya was a mathematician in the 1940s. He devised a systematic process for solving problems that is now referred to by his name: the Polya 4-Step Problem-Solving Process .
In this lesson, we will discuss each step of the Polya process while working through the solution to a problem. At the end of the lesson, you will have the opportunity to try more examples before taking your quiz.
Understanding the Problem
So, to start, let's think about a party. Sally was having a party. She invited 20 women and 15 men. She made 1 dozen blue cupcakes and 3 dozen red cupcakes. At the end of the party there were only 5 cupcakes left. How many cupcakes were eaten?
The first step of Polya's Process is to Understand the Problem . Some ways to tell if you really understand what is being asked is to:
- State the problem in your own words.
- Pinpoint exactly what is being asked.
- Identify the unknowns.
- Figure out what the problem tells you is important.
- Identify any information that is irrelevant to the problem.
In our example, we can understand the problem by realizing that we don't need the information about the gender of the guests or the color of the cupcakes - that is irrelevant. All we really need to know is that we are being asked, 'How many cupcakes are left of the total that were made?' So, we understand the problem.
Now that we understand the problem, we have to Devise a Plan to solve the problem. We could:
- Look for a pattern.
- Review similar problems.
- Make a table, diagram or chart.
- Write an equation.
- Use guessing and checking.
- Work backwards.
- Identify a sub-goal.
In our example, we need a sub-goal of figuring out the actual total number of cupcakes made before we can determine how many were left over.
We could write an equation to show what is unknown and how to find the solution: (1 dozen + 3 dozen) - 5 = number eaten
Carry Out the Plan
The third step in the process is the next logical step: Carry Out the Plan . When you carry out the plan, you should keep a record of your steps as you implement your strategy from step 2.
Our plan involved the sub-goal of finding out how many cupcakes were made total. After that, we needed to know how many were eaten if only 5 remained after the party. To find out, we wrote an equation that would resolve the sub-goal while working toward the main goal.
So, (1 dozen + 3 dozen) - 5 = number eaten. Obviously, we would need the prior knowledge that 1 dozen equals 12.
1 x 12 = 12, and 3 x 12 = 36, so what we really have is (12 + 36) - 5 = number eaten.
12 + 36 = 48 and 48 - 5 = 43
That means that the number of cupcakes eaten is 43.
The final step in the process is very important, but many students skip it, feeling like they have an answer so they can move on now. The final step is to Look Back , which really means to check your work.
- Does the answer make sense? Sometimes you can add wrong or multiply when you should have divided, then your answer comes out clearly wrong if you just stop and think about it. In our problem, we wanted to know how many cupcakes were eaten out of a total of 48. We got the answer 43. 43 is less than 48, so this answer does make sense. (It would not have made sense if we got an answer greater than 48 - how could they eat more than were made?)
- Check your result. Checking your result could mean solving the problem in another way to make sure you come out with the same answer. Basically, in mathematical terms, we are saying that 48 - 5 = 43. If we were to draw out a diagram of the 1 dozen blue cupcakes and 3 dozen red ones, then separate out the 5 that did not get eaten, we would see that we do, indeed, have 43 represented as the eaten cupcakes. Our answer checks out!
And that is all there is to Polya's 4-Step Process to Problem Solving:
So how about you try? Try using Polya's 4-Step Process to solve this riddle: There are 10 people at a party. Each person must say hello to each other person exactly once. How many times is the word 'Hello' said?
Step 1 - Understand the problem Okay, so we have 10 people saying hello, but they don't have to say hello to themselves, only to the 9 other people. I need to know how many times the word 'hello' is said. Got it.
Step 2 - Devise a plan A diagram might be a great to show me what is happening here. If I draw the diagram as a circle with 10 points (representing each of the 10 people), I can visualize each saying hello.
Step 3 - Carry out the plan Drawing the diagram of one person saying hello, we see that each person will have to say hello 9 times, thus there will be 10 people each saying hello 9 times. 10 x 9 = 90 hellos said.
Finally, Step 4 - Check your work 90 hellos might not make sense if there are 10 people; you might think the answer should have been 100. Well, to check our work with a problem like this, we could set up a different diagram. If we put the people in a straight line and then count them saying hello to each other one at a time, we will again see that the final tally is 90 hellos. 90 must be the correct answer. Remembering that they do not have to say hello to themselves may help you see why the answer can't be 100.
In this lesson, we reviewed Polya's 4-Step Process for Problem Solving , which is simply a systematic process used to reach a solution to a problem.
- Understand the Problem Restating the problem and identifying necessary information is a key to this step.
- Devise a Plan Use equations, diagrams, tables or any other tool needed to create a plan for solving the problem.
- Carry Out Your Plan Just do it!
- Look Back This means to review your work to double check your answer.
If you use these four steps when you approach any problem, be it math or otherwise, you will find your path to the solution much more direct and easy. Good luck!
Learning Outcomes
Following this lesson, you should have the ability to:
- Describe the steps in Polya's 4-Step Process for Problem Solving
- Explain the importance of having a plan to solve problems
- Apply Polya's process to problems
Unlock Your Education
See for yourself why 30 million people use study.com, become a study.com member and start learning now..
Already a member? Log In
Recommended Lessons and Courses for You
Related lessons, related courses, recommended lessons for you.

Polya's Problem Solving Process | Overview & Steps Related Study Materials
- Related Topics
Browse by Courses
- Algebra I: Credit Recovery
- Remedial Algebra I
- Algebra I Textbook
- 6th-8th Grade Math: Practice & Review
- High School Geometry: Homeschool Curriculum
- Geometry: Credit Recovery
- Fundamental Geometry
- High School Geometry Textbook
- Remedial Algebra II
- Algebra II Textbook
- Developmental College Mathematics
- Precalculus: Credit Recovery
- Business Math Textbook
- DSST Business Mathematics Prep
- Algebra for Teachers: Professional Development
Browse by Lessons
- Mathematical Problem | Definition, Principles & Uses
- How to Solve 5 Choose 2
- Using Reasonableness to Solve Math Problems
- Numerator | Definition & Examples
- Second-Person Point of View: Definition & Examples
- Negative Numbers | Definition, Rules & Examples
- Subtracting Polynomials | Methods & Examples
- 0.2 miles in Feet: How-to & Steps
- 1.62 Meters in Feet & Inches: How-to & Steps
- Algebra II Assignment - Graphing & Solving Linear Equations & Systems of Equations
- Algebra II Assignment - Working with Real Numbers
- Algebra II Assignment - Simplifying & Solving Exponential Expressions
- Algebra II Assignment - Using Roots & Radical Expressions
- Algebra II Assignment - Graphing, Factoring & Solving Quadratic Equations
- Algebra II Assignment - Working with Complex & Imaginary Numbers
Create an account to start this course today Used by over 30 million students worldwide Create an account
Explore our library of over 88,000 lessons
- Foreign Language
- Social Science
- See All College Courses
- Common Core
- High School
- See All High School Courses
- College & Career Guidance Courses
- College Placement Exams
- Entrance Exams
- General Test Prep
- K-8 Courses
- Skills Courses
- Teacher Certification Exams
- See All Other Courses
- Create a Goal
- Create custom courses
- Get your questions answered
Teach Starter, part of Tes Teach Starter, part of Tes
Search everything in all resources
Results for ‛Problem Solving Strategies - Make A Table Or Chart’
678 teaching resources
- Foundation Year 156
- Preschool / Kindergarten 55
- Year 1 299
- Year 2 360
- Year 3 402
- Year 4 354
- Year 5 299
- Year 6 235
- Year 7 59
- Worksheet 278
- Classroom Decor 129
- Crafts 69
- Classroom Management 56
- Teaching Slides 25
- Teacher Planning 10
- Assessment Tools 7
- Unit Plan 2
- Maths 263
- English 140
- Science 68
- Social Emotional Learning 38
- The Arts 14
- Health and Physical Education 12
- Technology 1
- Curriculum-Aligned 443
- Editable 106
- Differentiated 20
- Plus Plan 601
- Printable PDF 604
- Google Slides 384
- Microsoft PowerPoint 74
- Microsoft Word 21
- Studio 18
- Zip File 6
- Resource Pack 5
- Microsoft Excel 1
- Preschool / Kindergarten 55
- Foundation Year 156
- Task Cards 64
- Colour By Code 26
- Mini Books 16
- Writing Templates 8
- Cut and Paste 7
- Inquiry Based Learning 6
- Flipbooks 5
- Sorting Activities 4
- Brochures 2
- Fact Sheets 1
- Desk Name Plates 12
- Classroom Displays 9
- Word Walls 9
- Book Covers 1
- Page Borders 1
- Printable Letters 1
- Timetables 1
- Interactive Games 28
- Board Games 11
- Matching 10
- Escape Room 4
- Active games 3
- Chatterbox 2
- Colouring in pages 8
- Behaviour Management 35
- Classroom Procedures 21
- Teaching Slides 25
- Teacher Planning 10
- Assessment Tools 7
- Unit Plan 2
- Whole Number Operations 160
- Measurement 30
- Fractions 19
- Number Patterns 18
- Decimals 15
- Graphs and Data 14
- Place Value 12
- Number Sense 9
- Geometry & Space 5
- Money and Financial Mathematics 1
- Number Lines 1
- Percentages 1
- Speaking and Listening 2
- Biological Sciences 24
- Earth and Space Sciences 20
- Science Inquiry 12
- Physical Sciences 6
- Chemical Sciences 5
- Self Management 18
- Decision Making Skills 7
- Self Awareness 7
- Social Awareness 7
- Relationship Skills 2
- Multiculturalism 12
- Geography 9
- First Nations Peoples Histories and Cultures 2
- Visual Arts 11
- Personal, Social & Community Health 11
- Technology 1
- Curriculum-Aligned 443
- Editable 106
- Differentiated 20
- Plus Plan 601
- Printable PDF 604
- Google Slides 384
- Microsoft PowerPoint 74
- Microsoft Word 21
- Resource Pack 5
- Microsoft Excel 1

Elapsed Time Anchor Chart - Problem Solving Strategies

10 Problem Solving Strategy Cards

Problem Solving Strategies

10 Problem Solving Strategies Posters

My Amazing Invention - Planning Templates

What Is a Bar Model? How to Use This Maths Problem-Solving Method in Your Classroom

Big Problem, Little Problem Posters

Analysing Graphs (Single-Unit Intervals) Board Game

Analysing Graphs (Scaled Intervals) Board Game

Desk-Sized Multiplication Charts for Students

Addition to 1000 Sunflower Interactive Activity

Rainbow Facts - Zero-Tail Game

Skip Counting by 2,3,4,5, & 10 Mystery Picture

Area Model Multiplication Interactive Activity

Area Model Multiplication Worksheets

Multiplication and Division Word Problems Task Cards (Facts of 2, 5 and 10)

Multiplication and Division Word Problems Task Cards (Facts of 1-12)

Multiplication and Division Word Problems Task Cards (2-Digit by 1-Digit)

Multiplication With Equal Groups Spinner Activity

Addition within 20 Interactive Resource

Back to School Problem Solving Task Cards

Tacky Jumper Problem Solving & Observation Activity

How to be a Good Citizen - Problem Solving Activity
Numeracy Assessment Tracker - Aspect 2: Counting as a Problem Solving Process (NSW)

Addition Strategies: Make a Ten Worksheet

Problem Solving Mat

Addition and Subtraction Problem Solving Task Cards

Soccer-Themed Maths Problem Solving Worksheets

Can You Save Fred? Activity

Daily Maths Word Problems - Year 6 (Worksheets)

3-Act Maths Tasks - Time Word Problems

Converting Time Word Problems Worksheet

The Lost Library Card – Whole Class Escape Game

Daily Maths Problems – Year 5

Escape from Pete's Pumpkin Patch - Halloween Escape Room

Build a Crayon Box - STEAM Activity

Playdough STEM Challenge – Task Cards

End of Year STEM Challenge

Daily Maths Word Problems - Year 5

Daily Maths Problems - Year 3

Daily Maths Word Problems – Year 3

Mini-Mystery – Who Broke the Window? – Interactive PowerPoint

Mini-Mystery – Who Killed the Class Plant? – Interactive PowerPoint

Superheroes - Desk Reward Chart

Angle Word Problems Teaching Slides

Coping Skills Desk Plates

Cooperation Task Cards - Social Skills Activity

CUBES Classroom Display and Bookmark Set

Multiplication Tables - Students Charts

Hundreds Chart Strategy Addition Worksheet Pack

Desk Reward Chart - Zig-Zag

Hundreds Chart Strategy Addition Mini Book

Chocolate Buttons - Desk Reward Chart

Reading Comprehension Strategies Anchor Charts

Subtraction Strategies - Anchor Charts

Spelling Strategies - Anchor Charts

Rainbow Arches - Editable Desk Name Plates

Count and Graph – In the Classroom

Addition Strategies Task Cards

Converting Fractions and Decimals Interactive Game
We use essential cookies to make Venngage work. By clicking “Accept All Cookies”, you agree to the storing of cookies on your device to enhance site navigation, analyze site usage, and assist in our marketing efforts.
Manage Cookies
Cookies and similar technologies collect certain information about how you’re using our website. Some of them are essential, and without them you wouldn’t be able to use Venngage. But others are optional, and you get to choose whether we use them or not.
Strictly Necessary Cookies
These cookies are always on, as they’re essential for making Venngage work, and making it safe. Without these cookies, services you’ve asked for can’t be provided.
Show cookie providers
- Google Login
Functionality Cookies
These cookies help us provide enhanced functionality and personalisation, and remember your settings. They may be set by us or by third party providers.
Performance Cookies
These cookies help us analyze how many people are using Venngage, where they come from and how they're using it. If you opt out of these cookies, we can’t get feedback to make Venngage better for you and all our users.
- Google Analytics
Targeting Cookies
These cookies are set by our advertising partners to track your activity and show you relevant Venngage ads on other sites as you browse the internet.
- Google Tag Manager
- Infographics
- Daily Infographics
- Popular Templates
- Accessibility
- Graphic Design
- Graphs and Charts
- Data Visualization
- Human Resources
- Beginner Guides
Blog Business What is a Problem-Solving Flowchart & How to Make One
What is a Problem-Solving Flowchart & How to Make One
Written by: Danesh Ramuthi Aug 10, 2023

Problem-Solving Flowcharts, contrary to what many believe aren’t just aesthetic wonders — they’re almost like magical blueprints for troubleshooting those pesky problems that many of us face.
Flowcharts take business challenges and turn them into a navigable pathway. In this post, I will guide you on key aspects of problem-solving flowcharts such as what it is, the advantages of problem-solving flowcharts, how to create one and more.
Besides, you’ll also discover how to create problem-solving flowcharts with the help of Venngage’s Flowchart Maker.
And for those of you thinking, “I’m no designer, how can I create one?” worry not! I’ve got you covered. Just hop on Venggage’s Flowchart Templates and you’ll be charting your way to problem-solving glory in no time.
Click to jump ahead:
What are problem-solving flowcharts?
When to use problem-solving flowcharts, what are the advantages of flowcharts in problem-solving, what are the 7 steps of problem-solving flowcharts.
- 5 different types of problem-solving flowcharts
Best practices for designing effective problem-solving flowcharts
How to make a flowchart using venngage , problem-solving flowcharts faqs.
- Final Thoughts
Problem-Solving Flowcharts is a graphical representation used to break down problem or process into smaller, manageable parts, identify the root causes and outline a step-by-step solution.
It helps in visually organizing information and showing the relationships between various parts of the problem.
This type of flowcharts consists of different symbols and arrows, each representing different components or steps in the problem-solving process.
By following the flow of the chart, individuals or teams can methodically approach problem, analyze different aspects of it and come to a well-informed solution.

Problem-Solving Flowcharts is a versatile tool that can be used in various scenarios. Here’s when to consider utilizing one:
- Complex Problems: When faced with a multifaceted issue that involves multiple steps or variables, flowcharts can help break down the complexity into digestible parts.
- Team Collaboration: If you’re working with a team and need a common understanding of problem and its potential solutions then a flowchart provides a visual that everyone can refer to.
- Analyzing Processes: In a situation where you need to understand a particular process, whether it’s within a project or a part of regular operations then mapping it out in a flowchart can offer clarity.
- Decision Making: When various paths or decisions might be taken, a flowchart can outline the potential outcomes of each aiding in making an informed choice.
- Training and Onboarding: Flowcharts can be used in training materials to help new employees understand complex processes or procedures which makes the learning curve smoother.
- Identifying Root Causes: If you’re looking to identify the underlying causes of problem then a flowchart can facilitate a systematic approach to reaching the root of the issue.
Related: How to Use Fishbone Diagrams to Solve Complex Problems
Problem-solving flowcharts can offer several benefits to the users who are looking to solve a particular problem. Few advantages of flowcharts in problem solving are:
Visual Clarity
When you’re dealing with multifaceted problems or processes, words alone can make the situation seem even more tangled. Flowcharts distill these complexities into easily understandable visual elements.
By mapping out each phase or component of problem, flowcharts offer a bird’s eye view enabling individuals to grasp the bigger picture and the finer details simultaneously.
Sequential Representation
Flowcharts excel in laying out the sequence of events or actions. By indicating a clear starting point and illustrating each subsequent step, they guide users through a process or solution path methodically.
This linear representation ensures that no step is overlooked and each is executed in the right order.
Collaboration
Problem-solving often requires team effort and flowcharts are instrumental in fostering collaborative environments.
When a team is discussing potential solutions or trying to understand problem’s intricacies, a flowchart serves as a collective reference point.
It aids in synchronizing everyone’s understanding, minimizing miscommunications and promoting constructive discussions.
Read more about: Flowcharts Symbols and Meaning

1. Define the Problem
Before anything else, it’s essential to articulate the problem or task you want to solve clearly and accurately. By understanding exactly what needs to be addressed you can ensure that subsequent steps align with the core issue.
2. Identify the Inputs and Outputs
Determine what inputs (such as data, information or resources) will be required to solve the problem and what the desired outputs or outcomes are. Identifying these factors will guide you in structuring the steps needed to reach the end goal and ensure that all necessary resources are at hand.
3. Identify the Main Steps
Break down the problem-solving process into its main steps or subtasks. This involves pinpointing the essential actions or stages necessary to reach the solution. Create a roadmap that helps in understanding how to approach the problem methodically.
4. Use Decision Symbols
In problem-solving, decisions often lead to different paths or outcomes. Using standard symbols to represent these decision points in the flowcharts allows for a clear understanding of these critical junctures. It helps visually present various scenarios and their consequences.
5. Add Descriptions and Details
A well-designed flowcharts is concise but clear in its labeling. Using arrows and short, descriptive phrases to explain what happens at each step or decision point ensures that the flowcharts communicates the process without unnecessary complexity.
6. Revise and Refine
Creating a flowcharts is not always a one-and-done process. It may require revisions to improve its clarity, accuracy or comprehensiveness. Necessary refinement ensures that the flowcharts precisely reflects the problem-solving process and is free from errors or ambiguities.
7. Use Flowchart Tool
While it’s possible to draw a flowcharts manually, using a flowcharts tool like Venngage’s Flowchart Maker and Venngage’s Flowchart Templates can make the process more efficient and flexible. These tools come with pre-designed templates and intuitive interfaces that make it easy to create, modify and share flowcharts.

5 different types of problem-solving flowcharts
Let’s have a look at 5 most common types of flowcharts that individuals and organizations often use.
1. Process Flowchart s
A process flowcharts is a visual representation of the sequence of steps and decisions involved in executing a particular process or procedure.
It serves as a blueprint that showcases how different stages or functions are interconnected in a systematic flow and it highlights the direction of the process from its beginning to its end.

Process flowcharts are instrumental in training and onboarding, sales process , process optimization, documentation, recruitment and in any scenario where clear communication of a process is crucial.

2. Flowcharts Infographic
A flowcharts infographic is a great way to showcase the process or a series of steps using a combination of graphics, icons, symbols and concise text. It aims to communicate complex information in a clear and easy-to-understand manner, making it a popular tool for conveying information, data and instructions in a visually engaging way.

For example, you can use this flowchart to illustrate a health insurance process that visually explains the steps involved from finding a provider to paying for your healthcare provider.

3. Circular Flowcharts
A circular flowcharts is used to illustrate the flow of information, goods, services or money within a closed system or process. It gets its name from its circular shape, which emphasizes the continuous and cyclical nature of the flow.

Circular flowcharts are widely used in various fields such as economics, business, engineering and process management to help visualize and understand complex systems.
In a circular flowcharts , elements are represented using various shapes and connected with arrows to indicate the direction of flow. The circular arrangement indicates that the process is ongoing and repeats itself over time.

4. Swimlane flowcharts
Swimlane flowcharts , also known as cross-functional flowcharts are a specific type of flowchart that organizes the process flow into lanes or “swimlanes.”
Each lane represents a different participant or functional area involved in the process and the flowchart shows how activities or information move between these participants.

Swimlane flowcharts are particularly useful for illustrating complex processes that involve multiple stakeholders or departments.
In a swimlane flowcharts, the process is divided horizontally into lanes and each lane is labeled with the name of the department, person or role responsible for that part of the process. Vertically, the flowchart displays the sequence of steps or actions taken in the process.

5. Decision Flowchart s
Decision flowcharts, also known as decision trees or flow diagrams are graphical representations that illustrate the process of making decisions or solving problems.
They are widely used in various fields such as computer science, business mapping , engineering and problem-solving scenarios.

Decision flowcharts help break down complex decision-making processes into simple, sequential steps, making it easier to understand and follow.
A decision tree is a specialized flowchart used to visually represent the process of decision-making.
Businesses and other individuals can employ a decision tree analysis as a tool to aid in evaluating different options and the possible consequences associated with each choice.
Decision trees Infographics can be used to create a more nuanced type of flowchart that is more informative and visually appealing by combining a decision flowchart and the flowchart infographic.
Decision flowcharts are valuable tools for visualizing decision-making processes, analyzing complex problems and communicating them effectively to others.

Designing effective problem-solving flowcharts involves careful consideration of various factors to ensure clarity, accuracy and usability. Here are some best practices to create efficient and useful problem-solving flowcharts:
- Understand the problem first & clearly define it
- Keep it simple
- Use standard & recognizable symbols
- Ensure that the flowchart follows a logical and sequential order
- Clearly label each decision point, action and outcome
- Verify the flowchart’s accuracy by testing it
- Clearly state the decision criteria that lead to different branches
- Provide context when the flowchart is part of a larger process or system
- Review and revise the flowchart
Creating problem-solving flowchart on Venngage is incredibly simple. All you have to do is:
- Start by Signing Up and Creating an Account with Venngage
- Choose a flowchart template that best suits your needs from our library.
- Start editing your flowchart by choosing the desired shapes, labels and colors.
- You can also enhance your flowchart by incorporating icons, illustrations or backgrounds all of which are readily available in our library.
- Once done, you will have 2 options to choose from, either sharing it online for free or downloading your flowchart to your desktop by subscribing to the Premium or Business Plan.
Is flowchart the representation of problem solutions?
Flowcharts are not the representation of problem solutions per se; rather, they are a visual representation of processes, decision-making steps and actions taken to arrive at a solution to problem.
What are the 3 basic structures of flowcharts?
3 Basic Structures of Flowcharts are:
- Sequence: Simplify Complexity
- Selection (Decision): Embrace Choices
- Repetition (Loop): Emphasize Iteration
What are the elements of a good flowchart?
A good flowchart should exhibit clarity and simplicity, using consistent symbols and labels to depict a logical sequence of steps. It should be readable, with appropriate white space to avoid clutter while eliminating ambiguity through well-defined decision criteria and paths.
Can flowcharts be used for both simple and complex problem-solving?
Yes, flowcharts can be used for both simple and complex problem-solving scenarios. Flowcharts are versatile visual tools that can effectively represent various processes, decision-making steps and problem-solving approaches regardless of their complexity.
In both cases, flowcharts offer a systematic and visual means of organizing information, identifying potential problems and facilitating collaboration among team members.
Can problem-solving flowcharts be used in any industry or domain?
Problem-solving flowcharts can be used in virtually any industry or domain. The versatility and effectiveness of flowcharts make them applicable to a wide range of fields such as Business and Management, Software Development and IT, Healthcare, Education, Finance, Marketing & Sales and a lot more other industries.
Final thoughts
Problem-solving flowcharts are a valuable and versatile tool that empowers individuals and teams to tackle complex problems with clarity and efficiency.
By visually representing the step-by-step process of identifying, analyzing and resolving issues, flowcharts serve as navigational guides simplifying intricate challenges into digestible parts.
With the aid of modern tools like Venngage’s Flowchart Maker and Venngage’s Flowchart Templates , designing impactful flowcharts becomes accessible to all while revolutionizing the way problems are approached and solved.
Discover popular designs

Infographic maker

Brochure maker

White paper online

Newsletter creator

Flyer maker

Timeline maker

Letterhead maker

Mind map maker

Ebook maker
Numbers, Facts and Trends Shaping Your World
Read our research on:
Full Topic List
Regions & Countries
- Publications
- Our Methods
- Short Reads
- Tools & Resources
Read Our Research On:
Americans’ Dismal Views of the Nation’s Politics
1. the biggest problems and greatest strengths of the u.s. political system, table of contents.
- The impact of partisan polarization
- Persistent concerns over money in politics
- Views of the parties and possible changes to the two-party system
- Other important findings
- Explore chapters of this report
- In their own words: Americans on the political system’s biggest problems
- In their own words: Americans on the political system’s biggest strengths
- Are there clear solutions to the nation’s problems?
- Evaluations of the political system
- Trust in the federal government
- Feelings toward the federal government
- The relationship between the federal and state governments
- Americans’ ratings of their House member, governor and local officials
- Party favorability ratings
- Most characterize their party positively
- Quality of the parties’ ideas
- Influence in congressional decision-making
- Views on limiting the role of money in politics
- Views on what kinds of activities can change the country for the better
- How much can voting affect the future direction of the country?
- Views of members of Congress
- In their own words: Americans’ views of the major problems with today’s elected officials
- How much do elected officials care about people like me?
- What motivates people to run for office?
- Quality of recent political candidates
- In elections, is there usually at least one candidate who shares your views?
- What the public sees as most important in political candidates
- Impressions of the people who will be running for president in 2024
- Views about presidential campaigns
- How much of an impact does who is president have on your life?
- Whose priorities should the president focus on?
- How different are the Republican and Democratic parties?
- Views of how well the parties represent people’s interests
- What if there were more political parties?
- Would more parties make solving problems easier or harder?
- How likely is it that an independent candidate will become president?
- Americans who feel unrepresented by the parties have highly negative views of the political system
- Views of the Electoral College
- Should the size of the U.S. House of Representatives change?
- Senate seats and population size
- Younger adults more supportive of structural changes
- Politics in a single word or phrase: An outpouring of negative sentiments
- Negative emotions prevail when Americans think about politics
- Americans say the tone of political debate in the country has worsened
- Which political topics get too much – and too little – attention?
- Majority of Americans find it stressful to talk politics with people they disagree with
- Acknowledgments
The public sees a number of specific problems with American politics. Partisan fighting, the high cost of political campaigns, and the outsize influence of special interests and lobbyists are each seen as characteristic of the U.S. political system by at least 84% of Americans.
Yet 63% also say that “ordinary Americans care about making the political system work well” is a good description of U.S. politics today. Still, when asked to describe a strength of the political system in their own words, more than half either say “nothing” (22%) or decline to give an answer (34%).
Americans view negative statements as better descriptions of the political system than positive ones

More than eight-in-ten adults say that each of the following is at least a somewhat good description of the U.S. political system today:
- Republicans and Democrats are more focused on fighting each other than on solving problems (86%);
- The cost of political campaigns makes it hard for good people to run for office (85%);
- Special interest groups and lobbyists have too much say in what happens in politics (84%).
About six-in-ten (63%) think ordinary Americans want to make the political system work well. This is the rare positive sentiment that a majority views as a good descriptor of the political system.
Fewer than half of adults hold the view that the government deserves more credit than it gets: Majorities say that “the federal government does more for ordinary Americans than people give it credit for” (59%) and “Congress accomplishes more than people give it credit for” (65%) are both bad descriptions of the political system.
Nearly seven-in-ten adults express frustration with the availability of unbiased information about politics: 68% say the statement “it is easy to find unbiased information about what is happening in politics” is not a good description of the political system.
And just 22% of Americans say that political leaders facing consequences for acting unethically is a good description of the political system. They are more than three times as likely to say that this is a bad description (76% say this).
Many critiques of the political system are bipartisan
Partisans have similar views of many of the descriptions of the political system included in the survey.

Overwhelming majorities in both parties think there is too much partisan fighting, campaigns cost too much, and lobbyists and special interests have too much say in politics. And just 24% of Democrats and Democratic-leaning independents and 20% of Republicans and Republican leaners say that political leaders face consequences if they act unethically.
The widest partisan gap is over a description of the federal government. Democrats are roughly twice as likely as Republicans to say “the federal government does more for ordinary Americans than people give it credit for” (54% vs. 26%).
There is a narrower gap in views of Congress’ accomplishments: 37% of Democrats and 28% of Republicans say it accomplishes more than people give it credit for.
Democrats are also more likely to say, “It is easy to find unbiased information about what is happening in politics” (36% of Democrats and 25% of Republicans say this is a good description of the political system today), while Republicans are slightly more likely than Democrats to view ordinary Americans as wanting to make the political system work well (67% of Republicans and 61% of Democrats say this is a good description).

When asked to describe in their own words the biggest problem with the political system in the U.S. today, Americans point to a wide range of factors.
Negative characteristics attributed to politicians and political leaders are a common complaint: 31% of U.S. adults say politicians are the biggest problem with the system, including 15% who point to greed or corruption and 7% who cite dishonesty or a lack of trustworthiness.
The biggest problem, according to one woman in her 50s, is that politicians are “hiding the truth and fulfilling their own agendas.” Similarly, a man in his 30s says, “They don’t work for the people. They are too corrupt and busy filling their pockets.”
Explore more voices: The political system’s biggest problems
What do you see as the biggest problem with the political system in the U.S. today?
“An almost total lack of credibility and trust. Coupled with a media that’s so biased, that they’ve lost all objectivity.” –Man, 70s
“Lying about intentions or not following through with what elected officials said they would do.” –Woman, 20s
“Blind faith in political figures.” –Woman, 50s
“Our elected officials would rather play political games than serve the needs of their constituents.” –Woman, 50s
“Same politicians in office too long.” –Woman, 30s
“Extremism on both sides exploited by the mainstream media for ratings. It is making it impossible for both parties to work together.” –Man, 30s
“It has become too polarized. No one is willing to compromise or be moderate.” –Woman, 40s
“Too much money in politics coming from large corporations and special interest.” –Man, 30s
“The people have no say in important matters, we have NO representation at all. Our lawmakers are isolated and could care less what we want.” –Man, 60s
About two-in-ten adults cite deep divisions between the parties as the biggest problem with the U.S. political system, with respondents describing a lack of cooperation between the parties or among elected leaders in Washington.
“Both of the political parties are so busy trying to stop the other party, they are wasting their opportunities to solve the problems faced by our nation,” in the view of one man in his 70s.
Even as some blame polarization, others (10% of respondents) identify the other party as the system’s biggest problem. Some Republicans say that the biggest problem is “Democrats” while some Democrats simply say “Republicans.”
Smaller but substantial shares of adults name the media and political discourse (9%), the influence of money in politics (7%), government’s perceived failures (6%), specific policy areas and issues (6%) or problems with elections and voting (4%) as the biggest problem with the political system today.

Far fewer adults name a specific strength of the political system today when asked to describe the system’s biggest strength in their own words. More than half either say that the system lacks a biggest strength (22%) or decline to answer (34%). As one woman in her 60s writes, “I’m not seeing any strengths!”
Among those who do identify strengths of the U.S. political system, the structure of political institutions and the principles that define the constitutional order are named most frequently (by 12% of respondents). Many respondents specifically point to the Constitution itself or refer to the separation of powers or the checks and balances created by the Constitution.
A man in his 20s believes that the “separation of powers and federalism work pretty well,” while one in his 30s writes that the system’s greatest strength is “the checks and balances to make sure that monumental changes aren’t made unilaterally.”
Explore more voices: The political system’s biggest strengths
What do you see as the biggest strength of the U.S. political system today?
“Everyone getting a say; democracy.” –Woman, 40s
“The right to have your opinions heard.” –Man, 60s
“In spite of our differences, we are still a democracy, and I believe there are people within our government who still care and are interested in the betterment of our country.” –Woman, 50s
“The freedom of speech and religion” –Woman, 50s
“If we have fair, honest elections we can vote out the corruption and/or incompetent politicians.” –Man, 70s
“The Constitution.” –Man, 50s
“The checks and balances to control the power of any office. The voice of the people and the options to remove an official from office.” –Man, 60s
“New, younger voices in government.” –Woman, 40s
“If we can’t get more bipartisanship we’ll become weaker. Our biggest strength is our working together.” –Woman, 60s
“The way that every two years the people get to make their voice heard.” –Man, 30s
About one-in-ten (9%) refer to individual freedoms and related democratic values, while a similar share (8%) discuss the right to vote and the existence of free elections. A woman in her 70s echoes many similar comments when she points to “the possibility of change in upcoming elections.”
However, even some of the descriptions of positive characteristics of the system are couched in respondents’ doubts about the way the system is working today. One woman in her 50s adds a qualification to what she views as the system’s biggest strength, saying, “Theoretically every voter has a say.”
Smaller shares of the public point to the positive characteristics of some politicians (4%) or the positive characteristics of the American people (4%) as reasons for optimism.
The public remains roughly evenly split over whether there are clear solutions to the biggest issues facing the country. Half of Americans today say there are clear solutions to most of the big issues facing the country, while about as many (48%) say most big issues don’t have clear solutions.

There are relatively modest demographic and political differences in perceptions of whether the solutions to the nations’ problems are clear or not.
While both men and women are relatively divided on this question, women are 6 percentage points more likely to think the big issues facing the country don’t have clear solutions.
Race and ethnicity
While 43% of Hispanic adults and about half of Black (50%) and White (48%) adults say there aren’t clear solutions for most big issues, that rises to 62% among Asian adults.
Age differences on this question are modest, but those under 30 are slightly more likely than those 30 and older to say most big issues have clear solutions.
Partisanship and political engagement
Both Republicans and Democrats are relatively split on this question, though Republicans are slightly more likely to say there are clear solutions to most big issues.
Those with higher levels of political engagement are more likely to say there are clear solutions to most big issues facing the country.
About six-in-ten adults with high levels of political engagement (61%) say there are clear solutions to big issues today, compared with half of those with medium levels of engagement and 41% of those with lower engagement.
Sign up for our weekly newsletter
Fresh data delivery Saturday mornings
Sign up for The Briefing
Weekly updates on the world of news & information
- Election 2024
- Election System & Voting Process
- Federal Government
- National Conditions
- Political Animosity
- Political Discourse
- Political Parties
- Political Polarization
- State & Local Government
- Trust in Government
- Trust, Facts & Democracy
In GOP Contest, Trump Supporters Stand Out for Dislike of Compromise
What americans know about their government, congress has long struggled to pass spending bills on time, how the gop won the turnout battle and a narrow victory in last year’s midterms, narrow majorities in u.s. house have become more common but haven’t always led to gridlock, most popular, report materials.
1615 L St. NW, Suite 800 Washington, DC 20036 USA (+1) 202-419-4300 | Main (+1) 202-857-8562 | Fax (+1) 202-419-4372 | Media Inquiries
Research Topics
- Email Newsletters
ABOUT PEW RESEARCH CENTER Pew Research Center is a nonpartisan fact tank that informs the public about the issues, attitudes and trends shaping the world. It conducts public opinion polling, demographic research, media content analysis and other empirical social science research. Pew Research Center does not take policy positions. It is a subsidiary of The Pew Charitable Trusts .
© 2024 Pew Research Center
IMAGES
VIDEO
COMMENTS
Step 3: Solve the Problem. Make a table to organize the data. For this example, create a row for the slower car, a row for the faster car, and a column for each hour. Find the distance traveled during each hour by looking at the distances listed in each column. The distance of the faster car was more than the distance of the slower car in hour ...
Learn to problem solve by making a chart or table.We hope you are enjoying this video! For more in-depth learning, check out Miacademy.co (https://www.parent...
MAKE AN ORGANIZED LIST OR A TABLE Making a list or a table is a way to organize data presented in a problem. This problem solving strategy allows students to discover relationships and patterns among data. This strategy helps students to bring a logical and systematic development to their mathematics. Example 1:
After you finish reading the rest of the section, you can finish solving this problem for homework. Develop and Use the Strategy: Make a Table. The method "Make a Table" is helpful when solving problems involving numerical relationships. When data is organized in a table, it is easier to recognize patterns and relationships between numbers.
In this video, we explore one of eight problem-solving strategies for the primary math student. Students are introduced to the Make Table strategy and then s...
Make a table and look for a pattern: Procedure: Make a table reflecting the data in the problem. If done in an orderly way, such a table will often reveal patterns and relationships that suggest how the problem can be solved. ... Problem Solving Strategy 6 (Make a List) Example 1: Can perfect squares end in a 2 or a 3? List all the squares of ...
Come up with a way to solve the problem. Set up an equation, draw a diagram, make a chart, or construct a table as a start to begin your problem-solving plan. Step 3: Carry out the plan - Solve. Step 4: Check and Interpret: Check to see if you used all your information. Then look to see if the answer makes sense. Using a Table to Solve a Problem
• Make a table or chart. • Work "backwards". • Think of two different ways to solve it, then choose the one you think will work better. • Write it as a number sentence. Most important: Think carefully and clearly. Work with precision—make sure you know what the words in the problem mean. Make sure you are careful to check your work.
Problem-Solving Strategy Video: Make a Table or Chart. Use this teaching video from iMaths to teach the Problem-Solving Strategy 'Make a table or chart'. This is one episode from a series of 10 Problem-Solving Strategy videos available at iMaths Online.
Problem-Solving Strategy Video: Make a Table or Chart. Use this teaching video from iMaths to teach the Problem-Solving Strategy 'Make a table or chart'. This is one episode from a series of 10 Problem-Solving Strategy videos available at iMaths Online.
Make a table or a list. Carefully organize the information on a table or list according to the problem information. It might be a table of numbers, a table with ticks and crosses to solve a logic problem or a list of possible answers. Seeing the given information sorted out on a table or a list will help find patterns and lead to the correct ...
Practice this math problem solving strategy, Make a Table to Solve a Problem, with the help of these free printable problems. Download this make a table to solve a problem set of word problems for your 1st, 2nd and 3rd grade math students. These worksheets will be a helpful addition to your problem solving collection.
Solve problems by using graphs and tables.Examples of Waterford.org Measurement & Data Activities: https://www.youtube.com/playlist?list=PLcOxVO3wRlRTW3sTaC3...
What are the 4 problem solving steps? After carefully reading the problem, students will: Step 1: Circle the math words. Step 2: Ask yourself: Do I understand the problem? Step 3: Solve the problem using words and pictures below. Step 4: Share the answer along with explaining why the answer makes sense. Making & Using a Table to Solve Problems
EdrawMax has all the features you need to visualize your problem-solution map. For instance: You can insert tables, charts, timelines - anything that can help define and analyze the problem and/or solutions. You can add, remove, replace, and do much more with symbols and shapes through Predefine Libraries in EdrawMax.
Make a table or a list. Carefully organize the information on a table or list according to the problem information. It might be a table of numbers, a table with ticks and crosses to solve a logic problem or a list of possible answers. Seeing the given information sorted out on a table or a list will help find patterns and lead to the correct ...
To perform a cause-and-effect analysis, follow these steps. 1. Start with a problem statement. The problem statement is usually placed in a box or another shape at the far right of your page. Draw a horizontal line, called a "spine" or "backbone," along the center of the page pointing to your problem statement. 2.
A Step-by-step Guide to Solve Word Problems Involving Completing a Table and Making a Graph. To solve these problems, you will need to carefully read and understand the given information, identify the variables that need to be tracked and plotted, and use mathematical operations to calculate missing data points.
Review similar problems. Make a table, diagram or chart. Write an equation. ... Use equations, diagrams, tables or any other tool needed to create a plan for solving the problem. Carry Out Your Plan
This screencast shows an example of how to create a chart to solve an algebra application problem.
685 teaching resources. Problem Solving Strategies - Make A Table Or Chart. Sort: Relevance. Plus Plan.
Problem-Solving Flowcharts is a graphical representation used to break down problem or process into smaller, manageable parts, identify the root causes and outline a step-by-step solution. It helps in visually organizing information and showing the relationships between various parts of the problem. This type of flowcharts consists of different ...
Finding a suitable solution for issues can be accomplished by following the basic four-step problem-solving process and methodology outlined below. Step. Characteristics. 1. Define the problem. Differentiate fact from opinion. Specify underlying causes. Consult each faction involved for information. State the problem specifically.
1. The biggest problems and greatest strengths of the U.S. political system. The public sees a number of specific problems with American politics. Partisan fighting, the high cost of political campaigns, and the outsize influence of special interests and lobbyists are each seen as characteristic of the U.S. political system by at least 84% of ...