
Subscribe to Anthropocene's Newsletters
Join thousands of researchers, policymakers, designers, and educators who rely on Anthropocene to keep up to date on the latest sustainability and climate science and innovations.
Forward-Thinkers Wanted!
Newsletters Newsletters Science Dispatch (weekly) Fixing Carbon (twice a month)
Forward Thinkers Wanted
Sign up for Anthropocene's free newsletters
SCIENCE SHORTS
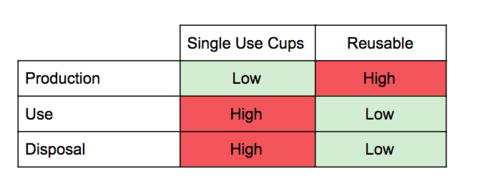
Reusable or Disposable Which coffee cup has a smaller footprint?
By Pierre-Olivier Roy
You walk into your local coffee shop, hand the barista your reusable coffee mug, and pat yourself on the back for not using one of those “bad for the environment” single-use cups.
Sounds simple. Right?
Granted, using a reusable cup lowers the waste-management environmental impacts. But you may not have considered other aspects of the cup’s life cycle such as the materials and energy that went into making your sturdier reusable cup, the soap and hot water that will be necessary to wash it, and the energy source behind the heat of this washing water. A recent life-cycle assessment (LCA) by the CIRAIG * tackled those issues. LCAs compile and evaluate the inputs, outputs, and potential environmental impacts of a product or service from material extraction to end of life.
The CIRAIG study compared the potential environmental impacts of a 16-ounce, single-use coffee cup made of a mix of cardboard and polyethylene (with a lid made of polystyrene) to those of a 16-ounce, reusable ceramic cup and to those of a variety of 16-ounce travelers’ mugs made of stainless steel, polypropylene, and polycarbonate. Over a one-year span (using one cup a day), the reusable cups scored well in the climate change arena—that is, they were associated with fewer greenhouse gas (GHG) emissions than their single-use counterparts. Likewise, they scored better in the human-health category for things such as toxic emissions, smog, and ozone depletion. They also tended to use fewer minerals and fossil fuels than disposable cups did.

Does that FSC label on forest products actually buy better wildlife protection in the jungles of Central Africa?

A global shift to flexitarian diets would buy critical time to meet climate targets

Do Carbon Prizes Work?

To slash building emissions, biomaterials are our friends

Get the latest sustainability science delivered to your inbox every week
Newsletters Science Dispatch (weekly) Fixing Carbon (twice a month)
You have successfully signed up
We will never share your email address unless you allow us to do so. View our privacy policy . Easy unsubscribe links are provided in every email.
Share This Article
Type search request and press enter
Mugs vs. Paper Cups: Essential Answer
Reading time min

Photo: SantiMB's flickr photostream
By Bethany Wylie
Q: I have an aversion to creating garbage, and as such, I find disposable coffee cups abhorrent. When I mentioned this to a friend once, his retort was, "Think of all the water you waste washing your ceramic mug, and the energy necessary to produce the mug in the first place." What are the real equations at play here? How many times would I have to reuse my mug to make it the ecologically "better" alternative?
Asked by Erik Uzureau, '01, Tuscon, Ariz.
As a born and bred Seattleite, I care a lot about the environment and coffee. I can remember one cold winter day stepping into a Starbucks back home and feeling good as I purchased a green plastic tumbler. But then, I started to think about the petroleum used to make that plastic, and the energy used to fire the kilns that bake ceramic mugs like yours. Does the reuse outweigh the environmental impact of making these reusable cups? The answer, luckily, is yes, so long as you keep them around long enough.
Your friend's skepticism aside, you really only need to use a ceramic mug about 18 times, or a plastic mug eight times, to break even with a paper cup in terms of water use, energy and waste. Each use after that means more environmental savings, and less garbage. Mugs hanging around your office tend to be used, on average, 50 times . My personal favorite plastic tumbler has probably held tea at least once a week over the three years I've had it, adding up to 150 uses or more-and 150 paper or Styrofoam cups not produced, used and thrown away.
But what happens when you forget your reusable cup? At most coffee shops, you are handed your java in the industry standard : a paperboard cup lined with lightweight plastic, which makes them unsuitable for recycling. But even disposable cups are getting a little better. In January of 2009, Stanford Dining converted almost all of its cafes to compostable serviceware, including compostable beverage cups with a biodegradable corn plastic liner. Now, they can be composted, helping to build healthy soil rather than piling up as garbage.
In terms of environmental impact, however, your drink of choice can be just as important as your choice of cup. More than 50 percent of American adults drink coffee daily, amounting to nearly 150 billion cups of coffee every year. From production, to preparation to disposal, drip filter coffee can produce the equivalent of 150 grams of carbon dioxide per cup consumed. That means that American consumption of coffee is responsible for the same amount of greenhouse gas emissions as nearly 4 million passenger cars each year. Conventional coffee is also very energy intensive and uses huge amounts of water. In fact, a single cup of drip filter coffee requires nearly 20 times the amount of water used to make the ceramic mug you drink it in.
The good news is that you have options to make your coffee choice more sustainable. Check out the Nitty Gritty for a more comprehensive discussion of responsible coffee. For now, just look for the Fair Trade logo when purchasing coffee. This certification is a holistic measure of a product's environmental and social goodness. And, if you forget your reusable mug, why not ask for a "for-here" mug instead? As the person in front of you orders a 10-ingredient latte, you can scan the menu for a more sustainable choice. Then take a few minutes to enjoy both that steaming cup of coffee and the good you are doing for the earth.
Bethany Wylie , '10, is a graduate student in earth systems.
Trending Stories
Advice & Insights
Health/Wellness
Law/Public Policy/Politics
You May Also Like
New light on the brain.
By combining genetics with fiber optics, Karl Deisseroth has given researchers a powerful tool with which to probe our most enigmatic organ.
Doing Business Better
GSB students reflect on Wall Street's bruised reputation.
- Letters to the Editor
Stanford Alumni Association
- Current Issue
- Past Issues
- Class Notes
Collections
- Vintage 1973
- Recent Grads
- Resolutions
- Mental Health
- Sandra Day O'Connor
- The VanDerveer Files
- The Stanfords
Get in touch
- Submit an Obituary
- Accessibility
- Privacy Policy
- Terms of Use
- Code of Conduct
- Stanford Home
- Maps & Directions
- Search Stanford
- Emergency Info
- Non-Discrimination
© Stanford University. Stanford, California 94305.
- International edition
- Australia edition
- Europe edition
Are single-use paper cups evil?
I n any urban conurbation you can observe trudging figures with disposable coffee cups clamped to their faces like poly-paper snouts. This gives the commuter the appearance of a Womble – unfortunately one less committed to making good use of rubbish.
Billions of single-use cups are thrown into landfill sites every year and, according to the WWF, to produce a single latte requires 200 litres of water, including the materials and manufacture of the paper cup and cardboard sleeve.
But is that stained ceramic novelty cup really so superior? In 1994 Professor Martin B Hocking of the University of Victoria in Canada carried out an analysis of the life cycles of beverage cups, pitching the reusable – ceramic, plastic and glass – against the disposable – paper and foam – also factoring in the energy use in manufacturing materials and cleaning of a reusable cup. The ceramic cup is environmentally preferable, but only if it is reused until it is retired. Drop and smash that cup early on and a paper-based disposable cup can almost match it for eco efficiency. A Dutch study later found the energy burden of washing the cup even more significant.
Meanwhile this planet's caffeine corporations are attempting to narrow the odds against disposable even more through innovation. Costa, which doles out 100m cups in the UK each year, is working on a "next generation" single-use cup with increased recycled content and FSC-certified pulp paper. It also points out its paper cups can be recycled (the process was tried out at a paper mill in Kent) but that recyclers "do not value the paper cup".
Valuing cups is a point Starbucks is keen to work on – not least at its annual Cup Summit. In 2006 it began using 10% recycled post-consumer waste in its cups – fairly revolutionary in recycling terms. The goal is to make 100% of cups reusable or recyclable by 2015.
So the eco superiority of the ceramic cup is being challenged. But avoid gloating. It is hard to think that millions of single-use cups aren't a ridiculous use of resources. We need to question why we have developed this habit of ingesting so many expensive caffeine products. If you're not ready to go cold turkey, invest in a reusable portable cup – a halfway house. The "barrista friendly" KeepCup has a new mini version for espresso and macchiato – the caffeine addict's eco compromise.
- Ethical and green living
- Ethical and green living with Lucy Siegle
Most viewed
- Newsletters
- Digital editions
- Login / Register
By Waqas Qureshi 6 August 2019
Life-cycle study shows paper cups have low carbon footprint
Paper cups often have the lowest carbon footprint, and recycling lowers it further by 54%, according to a new study.

Huhtamaki has participated in the life-cycle analysis study that surveyed the full carbon footprint of different types of cups used for coffee, with dishwashing energy adding to carbon footprint..
This life-cycle analysis (LCA) on paper cups was carried out in 2018-2019 by VTT Technical Research Centre of Finland Ltd. It was commissioned by Huhtamaki and the Finnish paperboard manufacturer Stora Enso.
Richard Ali, sustainability director for Huhtamaki Foodservice Europe-Asia-Oceania, said: “In many everyday uses, paper cups have the lowest carbon footprint, and they offer better food safety – they are always hygienic. Overall, the carbon footprint of a paper cup is small compared to the food itself. For example, for a take-away latte, paper cup accounts only for 4% of the climate impact. The remaining 96 % is coffee and milk production and the energy of making the drink.”
The study focused on two main scenarios: paper cups used either in a café or taken as a coffee-to-go.
In the café scenario paper cups were compared to ceramic cups, and in the coffee-to-go scenario paper cups were compared to cups made of reusable plastic and steel.
If the paper cup is recycled, or if 80% of the material will be recycled after use, paper cups are always the better option from a climate change point of view.
In addition, the efficiency or inefficiency of washing a ceramic cup is not only a matter of climate impact but an overall food safety and hygiene concern.
In the coffee-to-go scenario, the paper cups were studied with a plastic lid which secures the drink and prevents accidents. The study shows that a reusable plastic cup should be used at least 20 times to have a smaller climate impact than a paper cup – after taking cleaning into consideration.
If the paper cup is recycled after use and/or it is made with a plant polyethylene (PE) coating, the breakeven point increases to 32-36 times.
The end-of-life solution has a major impact on the CO2 emissions of paper cups. When the PE coated cups are 100% recycled the carbon footprint of cups can be reduced by 54%.
In Europe, the average recycling rate is 36%. The good quality fibre in paper cups can be recycled up to seven times.
Huhtamaki recently introduced a 100% renewable, plant polyethylene coated FutureSmart paper cup.
“We have brought to market the new FutureSmart paper cup, which is made from fully plant-based materials,” said Ali. “The paperboard is sourced from PEFC certified, sustainably managed forests, and the inside lining of the cup is made of plant-based PE. The paper cup is 100% renewable. According to the study, this type of a plant PE coated paper cup is the best performing paper cup option in terms of climate change impact.”
Plastic Education
Better decisions for a better life
Cups: Single Use (Disposable) vs. Reusable – An Honest Comparison

Is investing in a reusable cup or bottle really going to lower your environmental footprint?
This is a valid question and there has been confusion around this topic as there are many differing opinions.
In this post I will answer three main questions:
1. What’s the environmental impact of disposable cups?
2. What’s the environmental impact of reusable cups?
3. When are reusable alternatives better than single use cups?
If you’re in a rush, you can jump to a section below, or head straight to the overall assessment .
The Key Indicators of Environmental Impact
Cost of production, cost of use.
- Cost of Disposal (post use)
Reusable Options Overview
Disposable options overview: plastic cups vs. paper cups, the basics of comparing single use vs reusable.
Before answering any questions it’s important to understand why this is even a debate. Varying opinions on whether disposable cups are worse or better for the environment than reusable alternatives stem from unfair comparisons.
A few reasons why people may be comparing apples to oranges:
- Types – different types of disposable cups (paper, plastic, styrofoam) have varying impacts. Likewise, so do their reusable counterparts. This makes it difficult to make blanket statements like “all disposable cups are worse than reusable alternatives”
- Focus – you can paint a different picture depending on which aspect of environmental impact you’re focusing on. Energy use, natural resource use, pollution, and emissions, are just a few of the different areas you can compare. To be fair, you have to consider the complete environmental impact of disposable vs reusable, not just one aspect.
- Other – Other variables such as the technology used to manufacture the cup or how long it traveled to get the place of sale also change the environmental impact.
There are several variables to compare when it comes to rating the overall environmental impact of a product. Here are the main 3 areas and some of the considerations of each:
- Input of energy and natural resources
- Transportation of raw materials and finished product
- Emissions and other pollutants from manufacturing
- Impact on human health
- Lifespan of the product
- Environmental impact of use (if any) – example: washing of reusable cups
- Pollution of natural environment
- Emissions from disposal (gasses from breakdown in landfill or incineration)
- Cost of recycling
The total impact of a product can be calculated using our simplified formula:
Total Environmental Impact = Cost of Production + Cost of Use + Cost of Post Use
The Key Performance Indicators
There are also several different types of environmental impact. The most common types and the causes they are linked to include:
Emissions – global warming, air pollution
Natural Resource Use – deforestation, biodiversity loss, global warming
Pollution – biodiversity loss, degradation of natural environment
Some people may weight one factor as more important than another depending on their opinions of which environmental issue is most pressing.
The most common comparison for environmental impact is energy used to create, distribute, and dispose of the product.
Energy input is considered to be the primary indicator of environmental impact because it is tied to almost all other factors. It takes natural resources such as coal to create energy and once burned it contributes to emissions that fuel global warming.
In this comparison of disposable vs reusable cups I will draw from several studies about energy use in each phase: production, use, and post use.
It’s important to note that there are other considerations when buying a product such as the social responsibility of the company producing it. I’ll touch on these considerations in my summary.
In general, producing one disposable cup has a lower environmental impact than producing one reusable cup or bottle.
Measurement of Energy Input Needed (kJ/Cup) to Produce 1 Unit:
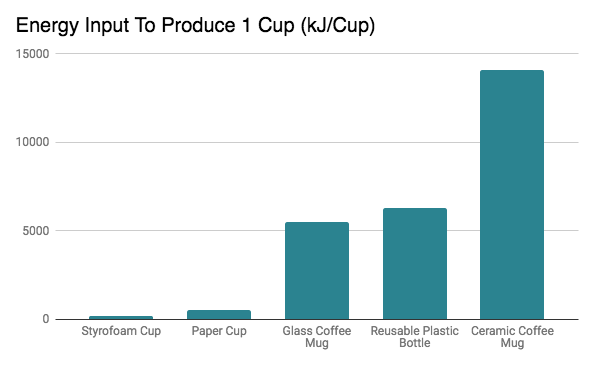
Producing a styrofoam or paper cup requires much less energy input than reusable alternatives such as plastic, glass, or ceramic.
This probably isn’t a big surprise to you. Disposable cups are smaller, lighter, and easier to make, while their counterparts require more input of resources and energy.
Proponents of single use cups may stop here and claim that disposables are more energy efficient and therefore more environmentally friendly. But the most critical evaluation happens in the next two phases: Use and Post Use.
In general, when comparing 1 cup to 1 reusable cup, the production of disposable cups is in fact more eco friendly.
It’s clear that the production of one disposable cup has a lower impact than one reusable alternative. But if you use over 300 disposables in a year, doesn’t that add up to be a greater impact than using only one reusable cup?
To calculate and compare the average cost of use for disposable cups vs reusables we have to answer one key question:
How many disposables are equal to the continued use of one reusable alternative?
The quick answer : this number ranges from 6 to 127 depending on various factors such as the type of reusable cup and how it is used.
Key Considerations – Washing Cups
A key factor in this aspect of the environmental impact of disposable vs reusable comes down to washing.
While disposables have no energy input necessary for their use, reusables do. In order to continue reusing a glass, plastic, or ceramic cup it needs to be washed which will contribute to its overall environmental impact.
Of course, there are different ways to wash cups and some are more eco friendly than others.
In general, washing by hand is more energy efficient than using a dishwasher. And washing with cold water is more energy efficient than washing with hot water.
The safest estimate to use is the energy use of a common household dishwasher.
Cost of Use: Summary
Considering the energy input to produce and to wash we can calculate a “break even” point, where using a reusable cup becomes as efficient as using a disposable cup.
The formula :
Break even number of uses = (Energy of Reusable cup)/(Energy of Disposable cup – Energy of wash)
The results :
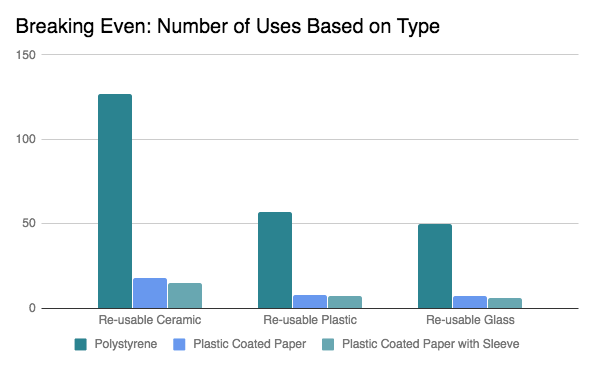
Main Takeaways
- Glass and plastic are the most energy efficient materials for reusable cups
- When replacing paper cups it takes less than 20 uses to become more efficient
- When replacing styrofoam cups (because energy input for this type is so low) it takes up to 127 uses
Most comparisons of disposable vs reusable cups end here. Although we’ve already determined that reusable cups are more eco friendly after continued use, we still don’t have the whole story.
What if all disposable cups are recycled and their materials are used over and over again?
We need to consider the environmental impact of disposal to have a complete understanding of how disposables stack up to reusables.
Cost of Disposal (post use)
The main factor to consider in disposal is how often cups are disposed of and how. Are they recyclable? What’s the impact of recycling them, sending them to the landfill, or other outcomes?
Are disposables recyclable?
Disposable cups are disposed of in mass and the most common type, used for coffee, are difficult to recycle. The vast majority of paper cups we use daily for takeaway drinks have a plastic lining in them that prevents to paper cup from becoming saturated and falling apart.
This plastic lining must be separated from the paper in the recycling process which makes recycling them difficult and costly. In fact, most recycling centers are not equipped to process them.
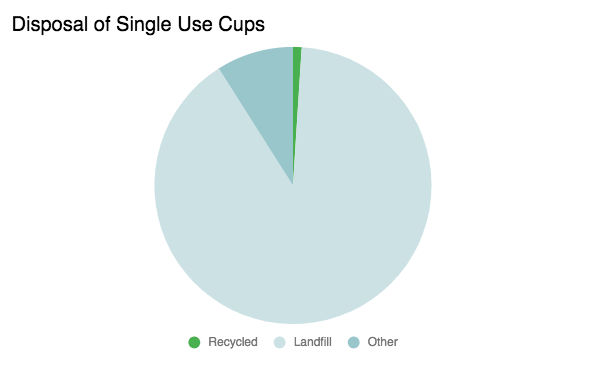
The result : Unfortunately right now only about 1% of disposable cups are recycled .
What is the cost of disposing single use cups?
It’s difficult to calculate the cost of disposing single use cups because of various scenarios. However, we should consider the following:
- Collecting and transporting used cups is energy intensive (think trash trucks)
- Once in a landfill cups may breakdown slowly in the right conditions but their plastics will take hundreds of years resulting in landfills that are wastelands
- Greenhouse gas release from landfills is a major contributor to global warming
- Cups that don’t make it to landfills pollute the natural environment
- Incinerating disposable waste will recoup some of the energy but also results in emissions that contribute to global warming and air pollution
- The sheer volume of disposable cups thrown away on a daily basis is hard to fathom (Starbucks alone produces 4 Billion each year)

How do reusables stack up?
Ceramic Cups – very little to no recycle potential but can last to thousands of uses if cared for and has little to no environmental impact in landfills
Plastic Alternatives – Many plastic alternatives can be recycled and will last for thousands of uses
Glass Cups – Can be recycled, will last for thousands of uses, and has little to no negative environmental impact in landfills
The bottom line
Reusable cups have a longer lifespan so their overall disposal impact is much lower than single use cups.
Most reusable cups can be recycled. Glass and ceramic are less of a threat to the natural environment because they will break down over time and do not contain synthetic chemicals, unlike styrofoam or the plastic lining of paper cups which do not biodegrade.
Disposal of single use cups poses other threats such as the cost of waste collection and the accumulation of these products in our oceans, when they are not taken to the landfill or incinerated.
OVERALL ASSESSMENT OF SINGLE USE VS REUSABLE
While it takes more energy to produce reusable cups, because they have a longer lifespan their overall environmental impact is much less than disposable cups.
Each type of disposable and reusable cup has its own variations in its impact on the environment. Some are better than others.
In general, the number of uses needed for a reusable bottle to be more eco friendly ranges from 6 to 127.
Glass cups are the best alternative . If you’re foregoing paper coffee cups by using a glass mug, you can be having a positive environmental impact in as few as 6 uses.
Reusable plastic cups are close behind glass . The break even point for reusable plastic cups can be as low as 7 uses.
Ceramic cups are also a good alternative but it will take more uses for them to become more environmentally friendly than disposable cups (as few as 15).
If you need to use a disposable cup, you’re often left to choose between paper and plastic cups. As we discussed above, there are many factors that determine the true environmental impacts of each type of cup.
Paper cups can biodegrade. This lowers their environmental impact, as they breakdown over time, while plastic cups sit in landfills for years. However, the carbon footprint of paper cups is higher than plastic cups, and uses more energy to produce.
Plastic cups (especially Styrofoam cups, a type of plastic) do not biodegrade, but has a lower carbon footprint and uses less energy than a paper cup to produce.
Another disposable cup option is the reusable aluminum cup , which can be recycled over and over again, and is typically made with more recycled content than paper or plastic cups. However, aluminum production releases a large amount of greenhouses gases and waste .
Ultimately, there is no clear winner among disposable cups, as the biodegradability of paper cups is mitigated by the high energy costs to produce them.
While reusing glass cups is ultimately the most environmentally sound option, the best option for disposable cups is one made from recycled materials, which are environmentally beneficial as they use less raw material to produce.
Main Takeaway
When assessing the sustainability of disposable cups vs reusables, it’s clear that reusables are more eco friendly when used repeatedly.
Although the impact of the production of single use cups is lower than reusables, the impact of their use and disposal is much higher.
Every use of a reusable cup is one sip closer to a more sustainable world.
If you’re ready to reduce your reliance on single use cups, check out our recommended reusable alternatives.
1. Energy and CO2 Analysis of Drinking Cups
2. Disposable Coffee Cup Waste Reduction Study
3. Reusable and Disposable Cups: An Energy Based Evaluation
4. Paper vs Polystyrene: A Complex Choice
Join the Conversation
Can you provide some references for the facts cited in your article about single use vs. reusable cups?
Hi David, a very interesting read. However you failed to mention the environmental impact that a plastic reusable cup will have in a landfill, unlike glass or ceramic, it will leak toxins and chemicals into the soil and water. Surely your conclusion should be that the nest reusable alternatives are glass or ceramic? For the good of the environment overall?
Hi there! I greatly appreciate your thorough and thoughtful assessment of this topic. I’d like to take a look at your sources as I’m working on a project regarding this topic as well, just having some trouble seeing the PDFs you linked – would you be willing to email me regarding this? Thank you for your time!!!
Leave a comment
Cancel reply.
You must be logged in to post a comment.

A Cup of Sustainability: Ceramic vs Paper Cups
Coffee shop culture has become more popular than ever and with it a proliferation of containers for drinking hot beverages seem to have taken over the world. With all of the different container choices available today it could be said that a person’s personality is shown through their cup of choice. So are you a disposable paper cup, or are you a more long-lasting ceramic take away cup?
In our culture paper cups are ubiquitous. Whether picking up a cup of coffee from Starbucks or grabbing a cup of joe at work, more often than not most people don’t think twice about taking the paper cup. A few years ago a powerful statement was made when a popular commercial showed the damage caused by plastic water bottles with an image of these bottles circling the globe. Just as powerful of a statement could be shown with a forest of trees being cut down to make a year’s worth of disposable paper cups.
The loss of trees is not the only environmental impact caused by a simple paper cup. A Canadian study at the University of Victoria compared the energy usage in manufacturing reusable cups with that of disposable cups. While manufacturing a ceramic cup took more energy than manufacturing a paper cup, the energy per use for a paper cup remained constant because they are thrown away after one use. This is in direct contrast to a ceramic cup whose energy per use decreases the more often it is used. Additionally, because most paper cups are coated with a polyethylene plastic they are all but impossible to recycle. This means that most paper cups end up in the landfill.
But what of the ceramic cups design? Does anyone really want to carry around a cup with world’s #1 fill-in-the-blank emblazoned across for all the world to see? Today’s modern ceramic design is stylish and trendy. Gone are the common and cliché mugs which end up collecting dust in the back of a kitchen shelf. Instead most people who use ceramic take away cups are now able to showcase their personality while drinking their hot beverage of choice.
When you live in a society which has conditioned you to think of most things in life as disposable, it can be hard to remember that the daily environmental and cultural impact of using disposable items quickly adds up. It may seem like using a ceramic mug won’t make a difference, but it’s important to remember that choosing reusable over disposable will always be the most sustainable choice.
You may also like

Benefits of Being a Multidisciplinary Designer
- , Paper cup
- “Taking a Closer Look at Paper Cups for Coffee” Life Cycle

Life cycle analysis study Taking a closer look at paper cups for coffee Taking a closer look at paper cups for coffee
Key findings Like all food packaging, the carbon footprint of a paper cup is small compared to the food itself. In most every-day scenarios, a paper cup has the lowest carbon footprint and is always a hygienic choice. Recycling drives lower greenhouse gas emissions. When recycled the carbon footprint of a paper cup falls by a significant 54%. If a traditional paper cup is swapped for Huhtamaki’s FutureSmart paper cup and is also recycled, the footprint falls by 64%. Paper cups are always the best choice for the climate if ceramic alternatives aren’t washed efficiently.
This report presents the results of a life cycle analysis (LCA) study on paper cups, which was carried out by VTT Technical Research Centre of Finland Ltd in 2018-19. Climate impact of paper cups
Learning more about the climate impact We use paper cups because they are easy-to-use, hygienic and give us the freedom to buy take- away hot and cold drinks. They are also safe and functional, especially with a matching lid. They meet the needs of modern life in a cost-effective way.
“At Huhtamaki we are passionate about the sustainability of our products, and we constantly want to know and understand more about this important subject. That’s why we set out to study the life cycle of a paper cup for coffee and its climate impact. We also wanted to find out what are the major critical aspects of paper cups and what could be improved.”
Richard Ali, Sustainability Director for Huhtamaki Foodservice Europe- Asia-Oceania
What are the paper cups worth and how do they compare to other cups?
In 2018-2019, we participated in a life cycle analysis (LCA) study on paper cups. The study was carried out by VTT Technical Research Centre of Finland Ltd and was commissioned by Huhtamaki and the Finnish paperboard manufacturer Stora Enso. The study focused on two main scenarios; paper cups used either in a café or in a take-away coffee-to-go serving. Paper cups were compared to ceramic cups in the café scenario and to reusable plastic and steel cups in the coffee-to-go scenario.
2 Life cycle analysis study Painting the big picture
Paper cups account for 4% of the climate impact of a take-away cafe latte 9% 14% 4% Before looking into the findings, let’s spend a moment to set the right perspective. Packaging generally represents some 5% of the total carbon Drink latte footprint of the food product. 80% is caused as you go by growing and preparing the food and 15% is caused by transport.
The findings were similar also in the case of 73% paper cups used for coffee. For example, the carbon footprint of a latte, without any cup, is approximately 230 g CO2-eq./one 8 oz latte. When the latte is served in a paper cup the Coffee production Milk use carbon footprint increases to 239 g CO -eq. and 2 Energy of making Cup with when a plastic lid is used it increases to 251 g the latte plastic lid CO2-eq. In other words, a paper cup accounts for just 4% of the climate impact of a take-away latte, while the remaining 96% is coffee and milk Carbon footprint of a cafe latte on-the-go production and energy of making the actual drink. If a plastic lid is added this accounts for 5%.
One way to understand the climate impact of paper cups is to compare it to driving a car; one cup with a lid has the same impact as driving 160-190 meters in a car.
Taking a closer look at paper cups for coffee 3 What do the numbers tell us?
Cups used in the study
The study included six different coffee cups. Three of them were paper cups In addition to these, there were three alternatives - Paper cup, standard polyethylene (PE) coating - Ceramic cups used in a café - Paper cup, plant-based polyethylene (PE) coating - Reusable cups for take-away made from plastic - Compostable paper cup (according to EN13432) - Reusable cups for take-away made from steel
In the breakeven point analysis, the study included both non-recycled and 80% recycled cups. The study included cup recycling up to 80%, which exceeds the European Union’s 2030 recycling target for packaging of 70%.
Comparison to ceramic cups used in a café The study suggests that even when washed efficiently, ceramic cups need to be used at least 350 times before There is no data currently available on how many having a smaller carbon footprint than that of a paper times the ceramic cups are used in real life, and cup. The data also shows that if the paper cup is recycled how long they last in a hygienic and presentable after use, or if more than 80% of paper cups are form in cafés or restaurants. For the study, a recycled, then paper cups are always the better option relatively high reference number of 1,000 uses from a climate change point of view. That’s also the case was chosen. when ceramic cups aren’t washed efficiently.
The major factor affecting the climate impact of The efficiency or inefficiency of washing a cup is not only ceramic cups was the efficiency of washing. This a matter of climate impact but an overall food safety and includes the use of clean water, detergent, energy hygiene concern. In many settings safe washing is not and the waste water treatment. The study found guaranteed, which creates a risk of bacteria building up that dishwashing causes more than 90% of the in the cup, especially if milk has been used in the coffee. life cycle emissions of a reusable cup. Additionally, ceramic cups cannot be used for take-away.
Breakeven point with the impact of washing calculated, number of servings in different cups (CFF method)
In the case of inefficient washing of ceramic cups, paper cups are always a better option from the climate impact point of view.
4 Life cycle analysis study Take-away paper cups compared to reusable In the case of reusable cups made of steel, these take-away cups made of plastic need to be used minimum 130 times to cause less
CO2 emissions than a take-away paper cup and The study also compared reusable plastic cups plastic lid. with paper cups used in a take-away setting where plastic lids secure the drink and prevent In the single-use take-away scenario, polystyrene accidents. Here, the study suggests that the lids make up the majority of the total climate impact reusable cups should be used at least 20 times of packaging. This is due to the energy intensity of to minimize climate impacts. If the paper cup is plastic production and the fact that polystyrene lids recycled afterwards and/or is made with a Plant are rarely recycled. The impact of a take-away paper PE coating, the breakeven point increases to cup with lid would be substantially lower if a fiber lid between 32 and 36 times. was used instead of a polystyrene one.
Breakeven point calculated with plastic reusable cups and paper cups with lids (CFF method)
Comparison of different types of paper cups
The study compared three types of paper cups. Plant PE coated cup was the best performing paper cup, having the lowest climate impact at 10.2 g CO2-eq./cup. Compostable cups typically require a thicker lining to achieve leak-proofing, and some fossil-content, which increases their carbon footprint.
The end of life scenarios are defined based on average European statistics: 30% to landfilling, 34% to incineration and 36% to recycling.
Taking a closer look at paper cups for coffee 5 Recycling makes a major difference
The study showed that the end-of-life solution 54% to 3.8 g CO2-eq. when 100% recycled. If plant-based has a major impact on the CO2 emissions of paper PE is used, and 100% of the cups are recycled, the carbon cups: The carbon footprint of regular PE coated footprint falls by 64% to 2.8 g CO2-eq./cup. These figures cups is 8.1 g CO2-eq. when disposed of according are calculated using the Circular Footprint Formula (CFF) to European averages, but can be reduced by method.
“This LCA has confirmed the positive impact recycling can have on our planet. The fiber in our paper cups can be recycled up to seven times, so by recycling we really are doing the right thing.”
Richard Ali, Sustainability Director for Huhtamaki Foodservice Europe-Asia-Oceania
Greenhouse gas emissions per cup when recycled
10 9 8 7 6 -eq./cup 2 5
g CO 4 3 2 1 0 Paper cup Paper cup recycled Plant PE paper cup
8.1 g CO2-eq. 3.8 g CO2-eq. recycled 2.8 g CO2-eq.
The carbon footprint per cup is measured according to the CFF method.
6 Life cycle analysis study Future Smart
The plant-based paper cup
Future Smart is a sustainable paper cup by Huhtamaki. Future Smart is made from fully plant-based materials and is 100% renewable. The paperboard is sourced from PEFC certified, sustainably managed forests. The inside lining of the cup is made of plant-based PE and can be recycled.
According to the study, this type of a plant PE coated paper cup is the best performing paper cup option in terms of climate change impact. By recycling the cup after use, the climate impact of the cup can be further reduced.
The Future Smart material is suitable for hot and cold drinks as well as for ice cream and take-away foods.
Conclusions
–– Like all food packaging, the carbon footprint of a paper cup is small compared to the food itself. –– In most every-day scenarios, a paper cup has the lowest carbon footprint and is always a hygienic choice. –– Recycling drives lower greenhouse gas emissions. When recycled the carbon footprint of a paper cup falls by a significant 54%. If a traditional paper cup is swapped for Huhtamaki’s FutureSmart paper cup and is also recycled, the footprint falls by 64%. The high quality wood fiber in Huhtamaki’s paper cups, which is sourced from sustainably managed forests, can be recycled up to 7 times before it loses its strength. –– Compostable cups are a good option when the cups are composted in the correct facilities. –– Paper cups are always the best choice for the climate if ceramic alternatives aren’t washed efficiently. –– Re-usable cups would need to be light-weight, used multiple times and be washed efficiently for them to result in lower greenhouse gas emissions than paper cups.
Taking a closer look at paper cups for coffee 7 What is a life cycle analysis? Key facts about this study
Life Cycle Assessment (LCA) is a method to assess the environmental impacts of a product over its entire life cycle, taking into account raw materials, manufacturing, use, transport and end-of- life options.
For this research, VTT Technical Research Centre of Finland Ltd carried out the comparative LCA study, which was jointly commissioned by Huhtamaki and Stora Enso. Catharina Hohenthal, Marjukka Kujanpää, Ivan Deviatkin, Marja Myllysilta and Matias Alarotu from VTT formed the research team.
A critical review panel reviewed the study in order to allow for public comparative assertions based on the results of the study. The study is fully compliant with ISO 14040 and ISO 14044 standards.
The results are not comparable with earlier studies. This study follows European Commission’s product environmental footprint (PEF) category rules for intermediate paper products. Cut off was the chosen allocation method but circular footprint formula (CFF) used to assess the impact of recycling rate.
Contact Information
Richard Ali Sustainability Director Huhtamaki Foodservice Europe-Asia-Oceania [email protected]
Global Communications Tel. +358 (0)10 686 7000 [email protected]
8 Life cycle analysis study
- Life Cycle Assessment (LCA) of Reusable and Single-Use Coffee Cups
- Creative Steps Christmas Projects Supplement 2018
- Referral to the Zero Waste Commission: Berkeley Single Use Foodware and Litter Reduction Ordinance
- Disposable Packaging: Coffee Cups
- Alphabetical Listing of Waste Classification
- Rethinking the Paper
- The Future of Single-Use Paper Coffee Cups: Current Progress and Outlook
- Off-Premise Dining Product CATALOG.Ai
- Santa Claus Paper Cup
- Product Catalogue 2017 / 2018
- 11 Bowls Plates.Qxd
- Transformation Inside This Issue President’S Message
- 2019 Course Resource List Table of Contents
- Waste Disposal Handbook Mishima (回復済み).Xlsx
- Case Study Ceramic Cup Vs. Paper Cup
- STEM Activities Geared Towards Middle and High School Students
- SCIENCE EXPERIMENTS with PAPER Steven W. Moje
- 159923 Brochure.Pdf
- Taking out the Trash: Identifying Sources of Trash in the Bay Area
- Product Brochure
- Studying the Effect of Price Signals on Disposable Hot Beverage Cup Consumption
- This Guide to Teaching Art in the Elementary Grades the Following Art Experiences Are Covered with Activities Classified Stitche
- Week 19 Summary & Preparation
- Design Attributes for a More Eco-Friendly Takeout Cup Using Conjoint Analysis
- Small Libraries Will Save the World! Implementing Sustainability at Your Library -Resource List
- Restaurant Procurement Guide
- Promising Pathways
- Quilling Group
- Should Plastic-Coated Paper Products Be Allowed in Materials Collected for Composting ?
- Paper Goods ✩ Observations Paper Is Made by Mixing Small Pieces of Wood with Water and Chemicals
- Single-Use Paper Cups Circularity Improvement and Environmental Impact Mitigation Measures for Lappeenranta University of Technology Campus †
- Faqs on RECYCLING PAPER CUPS for PAPER MILLS
- Focus on the Cup and the Coffee Culture Renewable and Circular – the Winning Combo in Packaging
- Capecup Product Catalogue.Indd
- Disposable Cups and the Environment
- Download (366Kb)
- Single-Use Beverage Cups and Their Alternatives
- Abilityone E-Commerce Pilot Comparing Usability and Prices of GSA Advantage and the Amazon Abilityone Pilot December 2018
- Ask a Question
Influence of the different processes in ecoinvent case study ceramic cup vs paper cup
I am learning openLCA these days and found one problem while studying the ceramic cup vs paper case.
With the database, I can get exactly the same figure as in fig. 8, but very different data as in fig. 9.
As the document shows, fig. 9 is the "influence of the different processes", but while calculating the systems, I do not have the value of transport processes straightforward because they are not directly connected to the "Ceramic mug use - by hand". My contribution tree looks like the following, which is different from fig. 9:
I thought that is because transportation is part of the production process so I broke it and added the numbers myself. The items with a red dot are considered "transport". The rest in ceramic mug production is considered "production".
However, my results still look very different from the document.
In my case, washing is 94.58%, production 4.49%, transportation 0.98%, waste treatment 0.01%, whereas in the document the washing is only about 85%,waste treatment about 8%.
The problem exists in all categories, not just in climate change.
Is there something wrong with the math I did or I did not understand the situation correctly?
I would appreciate any and all help!
Many thanks!
- impact analysis
- impact assessment
Please log in or register to add a comment.
Please log in or register to answer this question..
- All categories
- openLCA (2.3k)
- Miscellaneous (138)
- LCA Collaboration Server (57)
Related questions
- Question regarding OpenLCA Case Study Ceramic cup vs. Paper cup
- [The PET case study] Does not show environmental impact for the 'Allocation comparison'
- Closed-loop Allocation in the "Beer bottle: Aluminium can vs PET bottle" case study
- Problem with implementation of case study Avocado in PSILCA
- Beginner's question: no creation of product systems possible - error message when using PET Case study data
- Ecoinvent processes not showing up in OpenLCA
- Why does Eager/All calculation on processes always result in "Matrix is probably singular"?
- Any waste recycling case study for openLCA 1.7 or above?
- Empty project report with case study
- PSILCA and T-shirt case study
- No category
Report Ceramic cup vs Paper cup

Related documents

Add this document to collection(s)
You can add this document to your study collection(s)
Add this document to saved
You can add this document to your saved list
Suggest us how to improve StudyLib
(For complaints, use another form )
Input it if you want to receive answer
IMAGES
COMMENTS
Ceramic cup vs. Paper cup 4 Fig.8 Relative indicator results for every cup type, per impact category 13 Fig.9 Influence of the different processes on the use of a ceramic mug 13 Fig.10 Influence of the different on the washing of a ceramic mug 14 Fig.11 Relative LCIA results for the different cups, per impact category. 750 uses, but only 250 washings
reusable PP and ceramic cups: CupClub, 2018.....29 2.2.4 Single-use plastic-lined paper cup and reusable ceramic mugs: Martin, Bunsen and Ciroth, 2018..... 31 2.2.5 Reusable plastic (PP) and glass KeepCups, reusable bamboo and plastic cups and single-use PE- and PLA-lined paper cups: Almeida, Pellec and
The CIRAIG study compared the potential environmental impacts of a 16-ounce, single-use coffee cup made of a mix of cardboard and polyethylene (with a lid made of polystyrene) to those of a 16-ounce, reusable ceramic cup and to those of a variety of 16-ounce travelers' mugs made of stainless steel, polypropylene, and polycarbonate.
The aim of this paper is to analyse substitutes to disposable plastic tableware using the Life Cycle Assessment methodology. The alternatives are objects made of bio compostable plastic, both disposable and reusable. ... Case study - ceramic cup vs. Paper cup, s.l.: openLCA (1.7.2) (2018) Google Scholar.
Your friend's skepticism aside, you really only need to use a ceramic mug about 18 times, or a plastic mug eight times, to break even with a paper cup in terms of water use, energy and waste. Each use after that means more environmental savings, and less garbage. Mugs hanging around your office tend to be used, on average, 50 times.
Reusable vs. Disposable Cups. This classic life-cycle energy analysis was performed by University of Victoria professor of chemistry Martin B. Hocking. Hocking compared three types of reusable drinking cups (ceramic, glass and reusable plastic) to two types of disposable cups (paper and polystyrene foam). Table 1 - The embodied energy in each ...
Influence of the different processes in ecoinvent case study ceramic cup vs paper cup; The PET bottle case study - Waste incineration does not have environmental impact? (IPCC GWP 100a LCIA) Any waste recycling case study for openLCA 1.7 or above? Comparative assessment of reusable ceramic cups and disposable paper cups" (HELP!!!)
The ceramic cup is environmentally preferable, but only if it is reused until it is retired. Drop and smash that cup early on and a paper-based disposable cup can almost match it for eco ...
For the disposable paper cup, the production, use and end of life are assessed. The study is based on ecoinvent 3.4 and the LCIA method ILCD Midpoint+ (2016). Based on the results of the study, the use of a conventional ceramic cup with lid is strongly discouraged. A conventional ceramic cup without lid may be a greener option than disposable ...
Question regarding OpenLCA Case Study Ceramic cup vs. Paper cup; How to conduct a life cycle assessment with only information about type, material, and weight? How can we calculate the impact assessment of multiple processesand flows at once? What is the best database for life cycle assessment of solar energy?
In the café scenario paper cups were compared to ceramic cups, and in the coffee-to-go scenario paper cups were compared to cups made of reusable plastic and steel. If the paper cup is recycled, or if 80% of the material will be recycled after use, paper cups are always the better option from a climate change point of view.
Ceramic cups are also a good alternative but it will take more uses for them to become more environmentally friendly than disposable cups (as few as 15). Disposable Options Overview: Plastic Cups vs. Paper Cups. If you need to use a disposable cup, you're often left to choose between paper and plastic cups.
Ceramic cups with lid washed by hand ("Lid hand") result instead on average the worst alternative. 12 Ceramic cup vs. Paper cup. Tab.2: Life Cycle Impact Assessment results for the different cups, per impact category. In this table, "hand" and "dish" stand for the washing method, respectively by hand and by dishwasher.
The loss of trees is not the only environmental impact caused by a simple paper cup. A Canadian study at the University of Victoria compared the energy usage in manufacturing reusable cups with that of disposable cups. While manufacturing a ceramic cup took more energy than manufacturing a paper cup, the energy per use for a paper cup remained ...
Santa Claus Paper Cup; Product Catalogue 2017 / 2018; 11 Bowls Plates.Qxd; Transformation Inside This Issue President'S Message; 2019 Course Resource List Table of Contents; Waste Disposal Handbook Mishima (回復済み).Xlsx; Case Study Ceramic Cup Vs. Paper Cup "Taking a Closer Look at Paper Cups for Coffee" Life Cycle
Reusable". It is assumed that the lifespan of reusable ceramic mugs or KeepCups is 500 uses.! - 1 year, 48 weeks/year, 5 workdays/week, ~2 coffees/day! - Ceramic mugs have usually a max. lifespan of 1000 uses! - The firm KeepCup offers a warranty of 1 year, the cups are meant to be used several. times a day!
The end of life scenarios are defined based on average European statistics: 30% to landfilling, 34% to incineration and 36% to recycling. Taking a closer look at paper cups for coffee 5 Recycling makes a major difference. The study showed that the end-of-life solution 54% to 3.8 g CO2-eq. when 100% recycled. If plant-based has a major impact on ...
Studies performed by the European Union demonstrate that about 80% of sea waste is made of plastic, representing a danger to human health and ecosystem. The aim of this paper is to analyse ...
Question regarding OpenLCA Case Study Ceramic cup vs. Paper cup [The PET case study] Does not show environmental impact for the 'Allocation comparison' Closed-loop Allocation in the "Beer bottle: Aluminium can vs PET bottle" case study; Problem with implementation of case study Avocado in PSILCA; Beginner's question: no creation of product ...
Paper or expanded polystyrene are usually used for hot drinks. This link runs the numbers: In summary, ceramic is best. If you're clumsy or use a lot of hot water in washing the ceramic cup, you might just be better off using a polystyrene cup, maybe one per day. But if you get takeaway coffee it will come in a paper cup which is much worse.
This methodology has been applied to a case study, comparing four single-use cups with four reusable cups, by analyzing seven impact categories in three different use phase scenarios and two EoL scenarios. ... J., Ciroth, A., 2018. openlca 1.7.2, case study: ceramic cup vs paper cup.... G. Sonnemann et al. Integrated Life-cycle and Risk ...
The life cycle of ceramic cups processes are divided into four unit processes: production, use, washing and waste treatment (Figures 5 and 6). Whereas the paper cup includes only. three different unit processes: production, packaging, and use, while the waste disposal is part. of the use process (Figure 7). Ceramic.