

7 Airbnb in China – before, during and after COVID-19
Yixiao Xiang , School of Management, Shandong University, China
Lan Liu , School of Management, Shandong University, China
Sara Dolnicar , Department of Tourism, UQ Business School, The University of Queensland, Australia
Please cite as: Xiang, Y., Liu, L. and Dolnicar, S. (2021) Airbnb in China – before, during and after COVID-19, in S. Dolnicar (Ed.) Airbnb before, during and after COVID-19 , University of Queensland DOI: https://doi.org/10.6084/m9.figshare.14195930
Airbnb in China before COVID-19
China represents a unique market for tourist accommodation in general, and for peer-to-peer traded accommodation in particular. Chinese residents have a strong sense that one’s home is not intended for sharing beyond family and friends ( Xiang & Dolnicar, 2018) . Chinese tourists prefer using China-specific online trading platforms operated by Chinese people, prefer to search for accommodation in the Chinese language, and trust their own social network verification processes (such as Ctrip.com) more than those of foreign companies. Not surprisingly, therefore, Chinese tourists – especially young tourists ( Xiang & Dolnicar, 2018) – have not fully embraced Airbnb as an accommodation option when travelling domestically or internationally.
Airbnb initially launched its operations in China shortly after the company was founded in 2008 (Douban Group, 2009). The Chinese population learned about this new platform in 2009, primarily via a social media platform popular with young people in China called Douban Forum. The potential economic benefits from peer-to-peer accommodation platforms such as Airbnb – additional income tax, new employment opportunities, and contribution to GDP (Cai & Li, 2016) – ensured the support of the Chinese government (Analysis, 2016). Soon, policies and regulatory frameworks were put in place to facilitate the peer-to-peer trading of space among ordinary people (Iresearch, 2017), referred to as minsu . This term originates from Taiwan and refers to a “ civil house rented for short-term accommodation ”.
Rather than embracing Airbnb as the global market leader, the Chinese tourism industry reacted by implementing its own versions of online peer-to-peer accommodation trading platforms (Cai & Li, 2016). Airizu, for example, was set up in June 2011 and operated by Chinese entrepreneurs with the financial support of Rocket Internet Ltd., a German venture capital firm. This initial attempt at copying the Airbnb model failed in 2013 because the Chinese market was not yet familiar with the concept of peer-to-peer accommodation. Renting one’s home for money felt strange and foreign to Chinese people. Buying and selling real estate was perceived as more lucrative than engaging in the short-term rental market (Lei, 2013). Consequently, Airizu was unable to attract the number of listings and guests required to make a multi-sided platform business successful (Reinhold & Dolnicar, 2018).
The Airizu failure drew the attention of online travel agents to the potential of peer-to-peer accommodation trading. They entered the market and competed directly with peer-to-peer accommodation platform facilitators (Lei, 2013). In addition, Chinese entrepreneurs – familiar with the Chinese market – set up their own online peer-to-peer accommodation trading platforms, initially without depending on international venture capital. The top ten providers in China before COVID-19 were: Airbnb, Tujia, Xiaozhu, Mayi, Muniao, Youtianxia, Meituan, Onehome, Zizaike, and Locals (CNPP, 2020).
Arguably the most successful Chinese platform provider is Tujia. Tujia was founded in 2011 and then it absorbed Mayi (Sina.com, 2016). In 2016, it purchased the short-term rental divisions of major Chinese online travel agents (Ctrip & Qunaer), leading to a powerful strategic alliance (Ifeng.com, 2016; Iresearch, 2017). In 2019, Tujia was home to over 1,400,000 listings and employed 4,000 people at 1,347 destinations globally. Of all listings, 1,200,000 were in China and 200,000 were based outside China. In comparison, Airbnb – at the same time – had over 6,000,000 listings globally, but only 150,000 in China (Qianzhan, 2019; Fastdata, 2019). To gain market share in China, Airbnb put in place several targeted initiatives ( Xiang & Dolnicar, 2018) , including the launch of a Chinese language site in 2014, a China-based Airbnb company, a partnership with Alipay targeting young travellers (Guan & Wang, 2017), and travel stories on the Airbnb webpage to facilitate the sharing of information among travellers. Airbnb also introduced a Chinese name, Ai-bi-ying (爱彼迎), which means ‘Love (enables us) to welcome you’ ( Xiang & Dolnicar, 2018) , or – as Airbnb translates it – ‘Let love embrace each other’ (Airbnb, 2017). By the end of 2019, just before COVID-19 forced the global tourism industry into hibernation, Airbnb had succeeded in increasing its Chinese domestic market share to more than 50% (Xiong et al., 2020).
In 2019, despite having substantially fewer listings in China than other platform facilitators (150,000 compared to: Tujia 1,200,000, Meituan 700,000, Mayi 350,000, and Xiaozhu 340,000; Fastdata, 2020), Airbnb topped the list of online short-term rental platform providers in China in terms of overall brand quality and reputation (Sohu News, 2019). Airbnb’s Chinese market report for the first quarter of 2019 showed a three-fold increase of its business in China. Between January and February 2019, the number of active monthly Airbnb users of its iOS and Android apps in mainland China ranked first among all such platforms in the country (Sohu News, 2019). One of the reasons for this success is that Airbnb focused strongly on marketing efforts in second and third tier cities in China.
Another key opportunity for Airbnb in relation to China was outbound Chinese travellers. In 2013, 109 million Chinese tourists spent more than $100 billion on international travel. The number of Chinese people travelling outside of China had been showing continuous growth until COVID-19: 107 million in 2014, 117 million in 2015, 122 million in 2016, and 310 million in 2019 (China Tourism Academy, 2017; 2020). Airbnb bookings increased by 700% from 2012 to 2013 alone while Ctrip.com bookings increased even more (Qiu et al., 2016).
Airbnb in China during COVID-19
The unprecedented global travel restrictions and stay-at-home orders caused by COVID-19 resulted in a super-shock to peer-to-peer accommodation network facilitators (Dolnicar & Zare, 2020). Travel restrictions due to COVID-19 caused a drastic drop in Airbnb China’s revenue. In Wuhan, travel restrictions were in place as early as 23 January. Other provinces followed shortly thereafter, causing mobility within China to be effectively frozen. The transportation and accommodation sectors were most severely affected (Zhu & Kang, 2020). As a result, during the seven-day Chinese New Year holiday, more than 22% of minsu businesses lost RMB¥200,000-500,000. Another 8.7% lost more than RMB¥500,000 (Zhu & Kang, 2020). Airbnb was not spared. Airbnb’s revenue in Beijing dropped by 43% in March 2020 compared to March 2019 (Statista, 2020), and its occupancy rate was lower than 10%.
Hosts experienced cash-flow shortages because of the suspension of new bookings and the booking cancellation compensation policy announced by Airbnb in early February 2020. These measures complied with local regulations intended to curb the COVID-19 outbreak, and were subsequently extended in May 2020 (Fortune, 2020; The Business Times, 2020). As early as 21 January – in response to the sudden outbreak of the coronavirus pandemic – Airbnb China officially launched a special protection policy for booking cancellations to help those planning to travel to Wuhan (Travel Weekly China, 2020). Airbnb also refunded the service fee for those bookings.
To better understand the reactions of hosts, we conducted online and telephone structured interviews with 11 Chinese Airbnb hosts (between 20 July and 2 August 2020) and two unstructured face-to-face interviews with two medium-sized rural minsu owners on 19 November 2020. Details of study participants are included in the appendix. We asked the following questions: How many years have you listed your property on Airbnb? Has your perception of and preference for Airbnb changed over the years or not, and if so, in which way and why? Do you list your property on other peer-to-peer platforms such as Tujia or Xiaozhu? What advantages/disadvantages does Airbnb have over those competitors? How has COVID-19 affected your business on Airbnb over the past 6 months? How did Airbnb support you to survive? Do you have confidence in your future short-term rental business with Airbnb in the long run? How would you like to see Airbnb improve its operations?
The analysis of responses led to the following key findings:
L oss of bookings : All study participants confirmed that they experienced a dramatic loss of bookings following the official COVID-19 warning and announcements of travel restrictions. Interviewee #10 reported losing all bookings between 23 January and the middle of March. Interviewee #2 reported that her friends who also operate short-term rentals and list them on Airbnb suffered similar losses as she did, noting that revised refund policies caused a lot of confusion and communication difficulties during that period, which ruined her business performance during the 2020 Chinese New Year holiday.
Loyalty to the platform : Despite COVID-19-related challenges, none of the 11 interviewees expressed an intention to stop making their spaces available for short-term rental on Airbnb China. Interviewees #3, #4, #6, and #7 indicated that their attitude had changed towards Airbnb China; they initially felt suspicious, but over years of doing business with Airbnb they now fully trust it. Four study participants have been working with Airbnb for between two and five years – a relatively long period of time. Interviewee #1 expressed disappointment in the efficiency of Airbnb China’s customer service. 5 of the 11 study participants indicated that Airbnb is the only platform they currently use. The remaining interviewees also used other Chinese apps to list their properties.
Platform reaction and support during the C OVID -19 : 7 of the 11 participants reported having received support from Airbnb. Four benefitted from preferential policies offered by Airbnb China, such as discounted commission. The hotline for cancellation and refund enquiries was also mentioned by two participants, but they noted perceiving the hotline as inefficient and ineffective.
Confidence in the future business with Airbnb : All study participants expressed positivity about future business with Airbnb as an international booking platform. They all expressed confidence in and expectations for the forthcoming revival of the business once COVID-19 is completely under control around the world.
Suggestions for improvement : “ Improving t he quality of staff service of the platform will help the host to hold the guest a lot easier ” said Interviewee #1. Two study participants hoped for discounted commission and more platform promotions. One participant suggested that the platform should organise more activities and training for hosts. Three interviewees suggested making the booking app more user-friendly.
Overall, the key challenges for Airbnb China during the COVID-19 were shortage of cashflow, loss of listings, a low occupancy rate, booking cancellation refunds, host and guest loyalty, and maintaining confidence from both the hosts and the guests in the future of Airbnb China.
Airbnb in China after COVID-19
The substantial losses suffered by both the Airbnb platform and its hosts in China during the period of COVID-19 travel restrictions have put Airbnb under tremendous pressure to find an effective solution to secure its business in China after the pandemic. Dolnicar and Zare (2020) hypothesise that the proportion of hosts renting out space on Airbnb primarily for the reason of earning money will decline as a consequence of the business uncertainties caused by COVID-19, while the proportion of hosts making space available to travellers for other, more idealistic reasons, will increase again. This appears to describe the situation in China as well. Although no statistics have been officially released, several media articles noted that listing rates on platforms such as Airbnb, Xiaozhu, and Meituan minsu were all plummeting. People abandoning their peer-to-peer space trading operations were mainly people who rented other people’s properties to run online short-term accommodation businesses; they suffered the worst losses (Shen, 2020; Xu, 2020; ThePaper.cn, 2020).
The 11 Airbnb hosts we interviewed did not depend solely on Airbnb income, which explains why they were still listing spaces on Airbnb and were accessible to conduct interviews. Even among these hosts, their standard procedures changed because of COVID-19. Interviewee #10, for example, stopped hiring a cleaner to save costs, and cleaned the space herself instead. She explained: “ Although I know this pandemic will go away, I have to prepare to g et over the hard time s .”
On the platform side, Airbnb China saw a three-fold business increase in the first half of 2019 (year-on-year basis) and ambitious objectives for the first quarter of 2020 (Peng, 2019). COVID-19 shifted Airbnb’s original development plan in China from expansion to survival. At the time of writing, Airbnb China had taken the following steps:
Kep t losses to a minimum and protect ed brand credibility and sustainability : Airbnb cut its staff by 25% globally, affecting 85 staff at Airbnb China (CTNEWS, 2020). Airbnb also stopped all recruitment activities, halved CEO salaries, and ceased all marketing activities (Eastday.com, 2020a).
To comply with Chinese regulations regarding travel restrictions, Airbnb China announced a check-in suspension and developed a cancellation policy intended to protect the guests who booked and prepaid accommodation on Airbnb’s platform in China, the Chinese hosts listing their properties on the platform, and the platform facilitator itself.
When asked whether they encountered complaints from guests regarding cancellations or whether they made complaints to the Airbnb platform, two of the study participants (Interviewees #10 and #11) replied that with the guidelines provided by the platform they did not have a problem with cancellations. However, they noticed that there were some complaints posted online reflecting conflicts among guests, hosts, and the platform (BlackCat Complaints, 2020).
Secure d sufficient cash-flow to maintain health y operation of the platform : Budget-cutting measures were not enough to ensure sufficient cash-flow. Airbnb required cash to run its day-to-day operations, to take care of the host community, and to protect its brand reputation. Airbnb raised USD $1 billion in a new round of funding led by Silver Lake and Sixth Street Partners (Bosa & Batchelor, 2020), increasing confidence from its stakeholders and providing a lifeline for it to survive the turbulence of COVID-19, without losing too many of its listings.
Retain ed hosts and their listings : T he most impressive initiative Airbnb China took to protect their host community was to dedicate RMB 70 million to supporting Chinese hosts . Airbnb China also formulated the Ten Commitments in February 2020 during the initial coronavirus outbreak in Wuhan (Chen, 2020; Airbnb, 2020; Eastday.com, 2020 b ).
Airbnb China’s Ten Commitments to support its host community
- Refund Hubei hosts’ service fees
- Provide resource support and financial compensation
- Give priority to helping “heart-warming hosts”
- Empower landlords for long-term growth
- Strengthen various types of host training
- Reward the host community
- Extend the time for free cancellation
- Fully match employee donations
- Care for front-line pandemic professionals
- Strengthen the development of Chinese communities
Table 7.1: Airbnb China’s Ten Commitments to support its host community (source: Airbnb, 2020)
These measures demonstrate that Airbnb is acutely aware of the importance of retaining hosts and their listings. The Ten Commitments aim to protect and retain Chinese Airbnb hosts. They are summarised in Table 1 and shown in full detail in the appendix. As well as helping the host community, the Ten Commitments serve as a strategy to project a positive image of Airbnb in the Chinese market. Findings from the interview data show that Airbnb China’s efforts to retain hosts and listings have been effective: all 11 interviewees gave positive answers when asked about their overall perception of the future of Airbnb in China, eight talked positively about their hosting experience with the platform, and all expressed confidence in the future of Airbnb in China.
Based on the investigation of Airbnb China before and during the COVID-19 pandemic, we offer a few observations which have implications for the post-pandemic period:
Focus on younger travellers : Airbnb may want to consider redirecting its efforts toward the younger generation of travellers, especially those born in the 1980s and 1990s. Fastdata (2020) notes that the millennial and post-95 generations will be major forces influencing the Chinese travel market over the coming decade. Understanding their consumption behaviours and travel and accommodation needs – and catering to these needs – will strengthen Airbnb China’s competitive position. Peer-to-peer accommodation (online short-term rentals, or minsu ) is popular in this market segment, which enjoys independent travel and experiences with special value and meaning. The post-95 generation make up 20.7% of the minsu market, compared to 16.7% among post-90s and 12.3% among the post-80s. Fastdata (2020) predicts: “ Win the post-95 users, and you will win the future market ”.
Focus on the countryside : To increase post-pandemic supply, Airbnb may need to direct its efforts towards expanding its business from the cities into the countryside in China and integrating its products with rural tourism. Tujia launched its countryside minsu initiative as early as 2016 (Jiemian.com, 2016). Its countryside accommodation business grew by 300% in 2018 and another 200% in 2019, generating a revenue of RMB 500 million in 2018 and RMB 550 million in 2019 for minsu hosts (Tujia, 2019). In 2019, Tujia had 70,000 countryside minsu listings (rural lodgings), many catering to high-end customers with high turnout. The COVID-19 pandemic further fuelled market demand for accessible natural or rural destinations for weekends or short holidays, making rural accommodation the number one post-pandemic growth opportunity. Airbnb had already reached out to rural areas before the pandemic. By November 2018, 22% of all Airbnb China listings were in the countryside, with a 257% increase in listings and a 203% increase in hosts (Tang, 2018). However, considering the full picture of Airbnb’s listings in China compared to those of local Chinese platforms such as Tujia and Xiaozhu, Airbnb China still has a long way to go.
Enrich the host experience : Host community development has always been one of Airbnb China’s strengths and has helped to develop host loyalty. Our study participants described host community activities organised by the Airbnb platform as attractive and of benefit to them, and requested even more community activities in the future, such as online training, creative programs, and offline meetings and events (Interviewees #1, #3, #4, #8, #10, and #11). These requests offer an excellent opportunity for Airbnb China to further strengthen its links with hosts and, in doing so, increase the likelihood of them continuing to list their spaces on Airbnb in future.
Enrich the guest experience : Tujia and Xiaozhu introduced pick-up and drop-off services for guests at airports and train stations. Tujia also collaborated with Jingdong Express to provide an express luggage service for its guests (Sohu News, 2018, 2020). These services add substantial value to bookings for guests who are not travelling by car. During and after COVID-19 this value has further increased as these pickup services imply reduced human contact compared to taking public transport. Similar value-adding services could be introduced and maintained by Airbnb in the post-pandemic era, offering a competitive advantage, strengthening brand image, and encouraging market demand for Airbnb in China. Another alternative could be coupons or subsidies given to hosts by Airbnb to encourage them to provide pick-up and drop-off services for guests. This approach would allow Airbnb to maintain its asset-light strategy (not requiring any investment on its part) while encouraging increased host-guest interaction and enhancing host loyalty to the platform facilitator.
Collaborate : After its initial public offering and with sufficient available capital, Airbnb may wish to consider mergers and acquisitions. According to the latest unstructured interviews with two successful minsu owners in Shandong, the localisation of Airbnb in China could be facilitated by teaming up with or acquiring local players with growth potential. Although neither of the two interviewees are currently Airbnb hosts, both have previous negative hosting experiences with Airbnb China. According to them, Airbnb is favoured by hosts in first tier cities in China such as Beijing, Shanghai, Guangzhou, and Shenzhen. In second tier cities such as Qingdao and Jinan in Shandong, or even in rural areas, local platforms are much more successful in attracting domestic tourists. Airbnb could reach properties and domestic tourists by merging with and acquiring local peer-to-peer accommodation businesses, instead of competing against them. It should be noted, however, that there is a strong trend of monopolisation through mergers and acquisitions currently emerging in China, which is driven by domestic and international venture capitalists in the Chinese minsu (short-term rental) business. It is likely that this process will result in most minsu resources and businesses being acquired and controlled by a small number of large companies (similar to the process that led to the strong market position of Didi Taxi in China). Determining how to integrate local resources and strengths to gain competitiveness without straying from its original ethos – peer-to-peer accommodation offered by community members to community members – is perhaps one of the key future challenges for Airbnb in China.
Conclusions
The Chinese tourist market is unique. Airbnb learned this lesson quickly. Although Airbnb entered the Chinese market shortly after starting its operations as a peer-to-peer accommodation platform facilitator, it was not as successful there as it was in other markets around the world. The main reason for this is that local Chinese platform facilitators were quick in realising the potential of Airbnb’s business model and in successfully copying it. Chinese platform facilitators – in those early years – catered better to the needs of the Chinese tourists, giving them a competitive advantage over Airbnb (which was not as intimately familiar within this unique marketplace).
Over the years, Airbnb China learned to operate successfully in the Chinese marketplace and, before the COVID-19 pandemic hit, ranked first for perceived brand quality and reputation in China in 2019 (Sohu News, 2019). It also increased its Chinese domestic market share to more than 50% (Xiong et al., 2020).
COVID-19 significantly disrupted the business of Airbnb China and curtailed its ambitious development objectives. Key challenges for Airbnb China during COVID-19 include: a shortage of cashflow, loss of listings, a low occupancy rate, booking cancellation refunds, host and guest loyalty, and maintaining confidence from hosts in the future of Airbnb China.
For the post-pandemic era, Airbnb has a number of strategic options for rebuilding and growing its business, including: focusing on younger, educated Chinese tourists (the post-80s and post-90s generations); growing supply in the Chinese countryside and integrating their accommodation offerings with rural tourism products; further developing its host community to secure its loyalty into the future; introducing value-added services to match – or even surpass – those of its local Chinese competitors; and considering mergers and acquisitions with local peer-to-peer accommodation providers to facilitate its localisation efforts and its expansion into second and third-tier cities and rural areas.
Acknowledgements
This chapter is based on Xiang, Y. and Dolnicar, S. (2018) Chapter 13 – Networks in China, in S.Dolnicar (Ed.), Peer-to-Peer Accommodation Networks: Pushing the boundaries , Oxford: Goodfellow Publishers, 148–159.
Fieldwork was conducted by the Chinese authors of this book chapter who are from Shandong University, China. Fieldwork was approved via the human ethics approval process at Shandong University.
Airbnb (2017) Airbnb announced its latest plan for Chinese travellers, retrieved on August 21, 2017 from https://press.atairbnb.com/zh/airbnb-announces-new-plans-to-serve-chinese-travelers-zh
Airbnb (2020) Airbnb China has invested 70 million yuan as the special fund to fight the epidemic and to set up “10 Commitments” to restore confidence, retrieved on August 6, 2020 from https://news.airbnb.com/zh
Analysis (2016) The AMC model of Chinese online holiday renting market 2016, retrieved on August 21, 2017 from https://www.analysys.cn/analysis/22/detail/1000430
BlackCat Complaints (2020) Airbnb’s full refund policy during the COVID-19 is just a cover to cheat its guests, retrieved on August 6, 2020 from https://tousu.sina.com.cn/complaint/view/17349289141
Bosa, D. and Batchelor, L. (2020) Airbnb is raising $1 billion amid fallout from coronavirus, retrieved on August 6, 2020 from https://www.cnbc.com/2020/04/06/airbnb-raising-1-billion-amid-fallout-from-coronanvirus.html
Cai, D. and Li, X. (2016) Research on the development prospect of China’s hotel sharing platform, Jiangsu Review , 5, 10-12.
Chen, C. (2020) Airbnb China sets up 70-million-yuan special fund to restore confidence during Coronavirus outbreak, retrieved on August 6, 2020 from Panda daily: https://pandaily.com/airbnb-china-sets-up-70-million-yuan-special-fund-to-restore-confidence-during-coronavirus-outbreak
China Tourism Academy (2017) Tribute to the Chinese tourists – 2016 China outbound tourist large data, retrieved on August 21, 2017 from http://www.chinacloud.cn/show.aspx?id=24838&cid=6
China Tourism Academy (2020) Tribute to the Chinese tourists – 2019 China outbound tourist big data, retrieved on August 2, 2020 from http://www.ctaweb.org/html/2020-3/2020-3-10-16-48-64712.html
CNPP (2020) Top 10 short-term R&B brand names, retrieved on August 2, 2020 from https://www.cnpp.cn/china/list_6309.html
CTNEWS.com (2020) Airbnb laid off 25% of its workforce, possibly affecting 85 people in China, retrieved on August 2, 2020 from http://www.ctnews.com.cn/jdzs/content/2020-05/07/content_75134.html
Dolnicar, S. and Zare, S. (2020) COVID-19 and Airbnb – Disrupting the disruptor, Annals of Tourism Research , 102961, DOI: 10.1016/j.annals.2020.102961
Douban Group (2009) What can start-up companies learn from Airbnb? retrieved on August 21, 2017 from https://www.douban.com/group/topic/8962285
Eastday.com (2020 a ) Airbnb China invested 70 million yuan to set up a special fund and launched a green channel for free cancellation on Airbnb China, retrieved on August 6, 2020 from http://n.eastday.com/pnews/1580891764010112
Eastday.com (2020b) Airbnb has suspended recruitment and marketing due to the pandemic outbreak, retrieved on August 2, 2020 from http://n.eastday.com/pnews/1585618746019035
Fastdata (2019) Analysis Report on 2019 online minsu booking industry development in China, retrieved on August 2, 2017 from http://www.199it.com/archives/975961.html
Fastdata (2020) 2020 China online travel industry – Post 95s user data report, retrieved on August 2, 2020 from https://www.shangyexinzhi.com/article/2107954.html
Fortune (2020) Airbnb suspends all check-ins in Beijing amid the coronavirus outbreak, retrieved on August 6, 2020 from https://fortune.com/2020/02/10/airbnb-beijing-china-coronavirus
Guan, Z. and Wang, S. (2017) Can Airbnb make a breakthrough in the Chinese market by joining hands with ‘Alipay’?, retrieved on August 21, 2017 from http://www.bbtnews.com.cn/2017/0705/200384.shtml
Ifeng.com (2016) Tujia announced M&A of Mayi; Lightspeed China Partners was highly positive about ‘Internet +’, retrieved on August 21, 2017 from http://finance.ifeng.com/a/20160622/14515164_0.shtml
Iresearch (2017) Research report on the online short-term renting industry in China 2017, retrieved on August 21, 2017 from http://www.iresearch.com.cn/report/2944.html
Jiemian.com (2016) Optimistic about the rural vacation rental market, Tujia wants to go to the countryside, retrieved on August 6, 2020 from https://www.jiemian.com/article/586941.html
Lei, J. (2013) Airizu founder: Why it took two years to burn tens of millions of dollars but still go bankrupt? retrieved on August 21, 2017 from http://www.cyzone.cn/a/20131204/247502.html
Peng, T. (2019) Airbnb: The local strategy is effective, the monthly number of App users ranked first in the domestic industry in the first 8 months, retrieved on August 6 , 2020 from https://zhuhai.ihouse.ifeng.com/news/2019_09_17-52316698_0.shtml
Qianzhan (2019) Understanding the growth trend of the unicorn in 2018 China – Tujia, the biggest flow inlet of minsu (P2P accommodation), retrieved on August 2, 2017 from https://www.qianzhan.com/analyst/detail/220/190212-79a2b4b9.html
Qiu, R., Ou, S., Jiang, J. and Huang, L. (2016) The current situation and its countermeasures of Airbnb in China, Value Engineering , 31, 176-178.
Reinhold, S. and Dolnicar, S. (2018) Airbnb’s Business Model, i n S . Dol ni car (Ed.) , Peer-to-Peer Accommodation Networks: Pushing the boundaries , Oxford : Goodfellow Publishers, 27-38, DOI: 10.23912/9781911396512-3601
Shen, A. (2020) Under the epidemic, city homestays will face a major reshuffle, retrieved on August 6, 2020 from https://www.sohu.com/a/376435908_100191062
Sina.com (2016) Tujia announced M&A with Ctrip and Qunaer of their business sectors of apartment short-term rent and minsu , retrieved on August 21, 2017 from http://finance.sina.com.cn/chanjing/gsnews/2016–10–20/doc-ifxwzpsa8266027.shtml
Sohu News (2018) Tujia first launched the home stay platform airport business upgrade to ensure new travel experience, retrieved on August 6, 2020 from https://www.sohu.com/a/272442138_376259
Sohu News (2019) Three-fold increase of Airbnb business with localized “operating system”, retrieved on August 2, 2020 from https://www.sohu.com/a/308445727_202972
Sohu News (2020) Worry-free for family travel luggage w ith the help of Jingdong E xpress, Tujia minsu makes your travel and stay easy, retrieved on August 6, 2020 from https://www.sohu.com/a/366509353_100059725
Statista (2020) Year-on-year change in monthly revenue of Airbnb affected by the coronavirus COVID-19 pandemic in Beijing, China in 1st quarter 2020, retrieved on August 2, 2020 from https://www.statista.com/statistics/1110445/china-coronavirus-covid-19-pandemic-impact-on-airbnb-monthly-revenue-in-beijing
Tang, Y. (2018) Tujia rural loading is growing rapidly but still faces challenges from platforms such as Airbnb, retrieved on August 6, 2020 from https://www.chinaventure.com.cn/cmsmodel/news/detail/337048.html
The Business Times (2020) Airbnb extends Beijing suspension to May, retrieved on August 6 , 2020 from https://www.businesstimes.com.sg/technology/airbnb-extends-beijing-suspension-to-may
ThePaper.cn (2020) Airbnb: Many started to book accommodation for 1 May holiday, retrieved on August 6, 2020, from https://3g.163.com/house/article/F8Q6CFBE000782A4.html
Travel Weekly China (2020) Airbnb officially launches special protection policy for cancellation of bookings in response to the new coronavirus epidemic, retrieved on August 6, 2020 from https://www.travelweekly-china.com/81976
Tujia (2019) Tujia 2019 rural lodging data report, retrieved on August 6, 2020 from http://www.199it.com/archives/1040175.html
Xiang, Y. and Dolnicar, S. (2018) Networks in China, i n S . Dolnicar (Ed.) , Peer-to-Peer Accommodation Networks: Pushing the boundaries , Oxford : Goodfellow Publishers, 148-159, DOI: 10.23912/9781911396512 – 3611
Xiong, Y., Zhu, M. and Zhao, Y. (2020) Study on ethical risks of P2P accommodation platform -the case of Airbnb, Economy and Management , 1, 63-67.
Xu, C. (2020) Portraits of the accommodation hosts: Small entrepreneurs discouraged, while Ctrip and Airbnb struggling to saving themselves, retrieved on August 6, 2020 from https://finance.sina.cn/2020-04-03/detail-iimxyqwa4905492.d.html?from=wap
Zhu, K. and Kang, L. (2020) Research on the development of minsu business in the context of COVID-19, Journal of Beijing Vocational College of Agriculture , 34(3), 32-38.
Demographic characteristics of interviewees
| 1 | Guangdong | M | B19-35 | C Senior High | B Part-time job plus Airbnb host | B Part-time job plus Airbnb host | G 150,000+ | G 150,000+ | 5 |
| 2 | Zhejiang | M | B19-35 | C Senior High | C Full-time job plus Airbnb host | C Full-time job plus Airbnb host | G 150,000+ | G 150,000+ | 2 |
| 3 | Hainan | M | B19-35 | D Bachelor | D Full-time Airbnb host | C Full-time job plus Airbnb host | D 60,001 -100,000 | D 60,001 -100,000 | 4 |
| 4 | Guangdong | F | B19-35 | D Bachelor | C Full-time job plus Airbnb host | C Full-time job plus Airbnb host | E 100,001 -150,000 | D 60,001 -100,000 | 5 |
| 5 | Hebei | M | B19-35 | D Bachelor | D Full-time Airbnb host | D Full-time Airbnb host | G 150,000+ | E 100,001 -150,000 | 3 |
| 6 | Yunnan | M | B19-35 | D Bachelor | B Part-time job plus Airbnb host | B Part-time job plus Airbnb host | C 40,001 -60,000 | C 40,001 -60,000 | 2 |
| 7 | Jiangsu | M | B19-35 | D Bachelor | C Full-time job plus Airbnb host | C Full-time job plus Airbnb host | E 100,001 -150,000 | E 100,001 -150,000 | 4 |
| 8 | Guangdong | M | B19-35 | D Bachelor | C Full-time job plus Airbnb host | C Full-time job plus Airbnb host | E 100,001 -150,000 | D 60001 -100,000 | 0.75 |
| 9 | Fujian | F | C 36-55 | B Junior High | C Full-time job plus Airbnb host | C Full-time job plus Airbnb host | C 40,001 -60,000 | B 20,001 -40,000 | 2 |
| 10 | Shandong | F | B19-35 | D Bachelor | B Part-time job plus Airbnb host | B Part-time job plus Airbnb host | D 60,001 -100,000 | C 40,001 -60,000 | 2 |
| 11 | Shandong | M | B19-35 | D Bachelor | C Full-time job plus Airbnb host | C Full-time job plus Airbnb host | E 100,001 -150,000 | D 60001 -100,000 | 2 |
Airbnb China’s Ten Commitments to support its host community
| 1. Refund Hubei hosts’ service fees: | Promises to refund the host service fee for all Hubei listings. This policy applies to bookings made before 5 February 2020 for the check-in period 5 February 2020 – 1 May 2020. |
| 2. Provide resource support and financial compensation: | Promises to launch the “Green Channel” program, which streamlines the cancellation process for hosts and guests. This program applies to bookings made before 28 January 2020 for stays between 2 – 29 February 2020. Promises to provide hosts with more resource support and certain financial compensation for booking cancellations within the defined period. |
| 3. Give priority to helping “heart-warming hosts”: | Promises to give priority to tilting the flow of weekly and monthly rent orders to hosts identified as “heart-warming hosts” to reward their contribution to the host community. More incentives will follow for the “heart-warming hosts”. |
| 4. Empower landlords for long-term growth: | Promises to launch a landlord growth plan, including: giving high-quality hosts access to “high-quality listing” and “plus listing” badges, encouraging and helping hosts to upgrade their properties and to optimise their service capacity. |
| 5. Strengthen various types of host training: | Promises to expand the number and content of China’s host training programs to cover hosts in both urban and rural areas, to increase knowledge of safety, hygiene and operations, and to improve the host’s ability to deal with major public safety emergencies. |
| 6. Reward the host community: | Promises to put the host community at the core of its business development plan, and raise the global profile of the Chinese host community and its successes against the pandemic, through programs such as annual host awards, “host of the month” awards, community activities, and Chinese landlord incentive programs, story-sharing of Chinese host fighting against coronavirus pandemic, etc. |
| 7. Extend the time for free cancellation: | Promises to extend the “Special Circumstances Policy” until 29 February 2020 (until 1 April 2020 in Hubei Province). The booking date must be before 28 January 2020 (bookings from mainland China) or 1 February 2020 (bookings from outside China). Airbnb will continue to evaluate and adjust this policy in light of the pandemic situation. |
| 8. Fully match employee donations: | Promises to fully match donations made by the company’s global employees to the non-profit Give2Asia, for the purchase of masks, protection suits, and eye protectors for medical staff. |
| 9. Care for front-line pandemic professionals: | Promises that front-line medical workers and other professional staff who cannot complete their itineraries due to the pandemic may cancel their Airbnb bookings free of charge upon verification of relevant certification materials. Airbnb promises to provide targeted travel funds for outstanding front-line medical workers to thank them for their great contributions in the fight against the pandemic. |
| 10. Strengthen the development of Chinese communities: | Promises to increase marketing activities that are strategic to the Chinese market in the post-pandemic era, encourage more people to sign up as hosts and guests, and achieve the healthy development and sustainability of host community growth. |
Airbnb Before, During and After COVID-19 Copyright © 2021 by The University of Queensland is licensed under a Creative Commons Attribution 4.0 International License , except where otherwise noted.
Digital Object Identifier (DOI)
https://doi.org/10.6084/m9.figshare.14195930
Share This Book
Chinese Tourists Agency

Airbnb in China: Why Did The Company Fail?
Ever find yourself pondering over why Airbnb , the global giant in home-sharing services , stumbled when it came to cracking into China’s market? Trust me, you’re not alone. I too was left scratching my head and decided to do a little detective work.
My investigation shed light on an intriguing blend of culture clashes , intense competition from local rivals , and legal hurdles that majorly contributed to this unexpected misstep .
In this blog post, we’ll navigate through the complex labyrinth of challenges Airbnb faced and extract some valuable lessons from their Chinese chapter gone awry. Stay tuned!
Key Takeaways
- Airbnb faced strong competition from domestic platforms like Tujia and Xiaozhu, who had a better understanding of the Chinese market and established themselves before Airbnb could make its mark.
- Cultural differences and trust issues played a significant role in Airbnb’s failure in China, as people were hesitant to stay in strangers’ homes , preferring traditional accommodations or staying with family and friends.
- Regulatory restrictions and legal challenges posed major obstacles for Airbnb, with cities saying no to short-term rentals and potential new laws requiring data sharing outside of China. These challenges made it difficult for Airbnb to operate within the country.
- Lack of localized strategies and adaptations was another reason for Airbnb’s failure in China, as they didn’t fully understand the specific needs of Chinese travelers or adapt their branding and marketing messages effectively. This resulted in a disconnect between their offerings and what the target audience wanted .
Challenges Faced by Airbnb in China
Airbnb in China struggled with strong competition from domestic players, cultural differences that led to trust issues, and regulatory restrictions and legal challenges.
Strong competition from domestic players
Local big names like Tujia and Xiaozhu were giving Airbnb a run for its money in the domestic business. They were hard to beat . These platforms knew the Chinese market well. They took over the home-sharing space before Airbnb could make its mark.
The cut-throat rivalry didn’t help Airbnb’s cause. It became tough to stand out with so many foes in the field of vacation rentals. Domestic players had a strong grip on the market , making it rough for Airbnb to thrive or even survive in China .

Cultural differences and trust issues
China is different. Airbnb had a tough time with that. People in China do things their own way. They like to stay with the ways they know and trust. This was a big problem for Airbnb when it tried to start there.
The folks there did not understand or trust the idea of staying in strangers’ homes . They usually travel in groups and stay in luxury hotels. The idea of staying in someone’s home didn’t feel safe for them.
Tujia, a local company like Airbnb, knows these Chinese ways better. It uses them well and has done good business because of it.
Airbnb tried hard but could not win enough trust from people in China. Many people call China a low-trust country towards new ideas from outside.
This idea of sharing homes was also all-new and weird for many people in China at first, making it harder still for Airbnb to build its business there.

Regulatory restrictions and legal challenges
China has its own unique rules for Internet businesses . These rules acted like a brick wall to Airbnb. Cities in China started saying no to short-term rentals . This was a big hit to Airbnb’s business model there.
Then came potential new laws from the Chinese government. They aimed at sharing data outside of the country’s borders . The legal battles were as hard as fighting off rivals from home soil!
Lack of Localized Strategies and Adaptations
Airbnb failed in China primarily because it lacked localized strategies and adaptations that catered to the specific needs of Chinese travelers.
Failure to understand and cater to the specific needs of Chinese travelers
When Airbnb entered the Chinese market in 2013, they didn’t fully understand and cater to the specific needs of Chinese travelers . The concept of peer-to-peer accommodation was new to them, and they were more accustomed to staying in traditional hotels or with family and friends .
Additionally, Airbnb’s attempt to use disparate Chinese characters to evoke the idea of hospitality was seen as a cultural misstep . This lack of cultural understanding and adaptation made it difficult for Airbnb to gain traction in China.
They also had to comply with strict regulations by confirming and verifying real identities, which further hindered their progress.
On top of that, they forgot about offering exclusive discounts and promotional codes . Chinese people enjoy exclusive discounts often and they are used to local platforms offering them on a daily basis.

Insufficient localization efforts in terms of branding and marketing
When it comes to Airbnb’s failure in China, one of the reasons was their insufficient efforts in localizing their branding and marketing strategies. They didn’t understand the specific needs and preferences of Chinese travelers , which resulted in a disconnect between their offerings and what the target audience wanted.
Additionally, they didn’t adapt their branding and marketing messages to resonate with the local culture effectively. This lack of localization made it difficult for Airbnb to compete with domestic players who had a better understanding of the market.
To be successful in foreign markets like China, companies need to invest time and resources in conducting thorough market research , segmenting their target audience, adapting language localization, and creating localized branding campaigns that appeal directly to consumers’ preferences and behaviors.

Impact of COVID-19 Pandemic
The COVID-19 pandemic greatly impacted Airbnb’s presence in China, with travel restrictions and a decline in tourism leading to decreased demand for short-term rentals.
Travel restrictions and decline in tourism
The COVID-19 pandemic has had a big impact on tourism in China. There were travel restrictions in place and fewer people were traveling, which has led to a decline in tourism . This means that there was (and still is) less demand for accommodations , including short-term rentals like those offered by Airbnb.
The pandemic has caused a collapse of the tourism industry in China, as it’s been difficult to control the spread of COVID-19 . It’s not just happening in China – the global tourism industry has also been greatly affected by the pandemic.
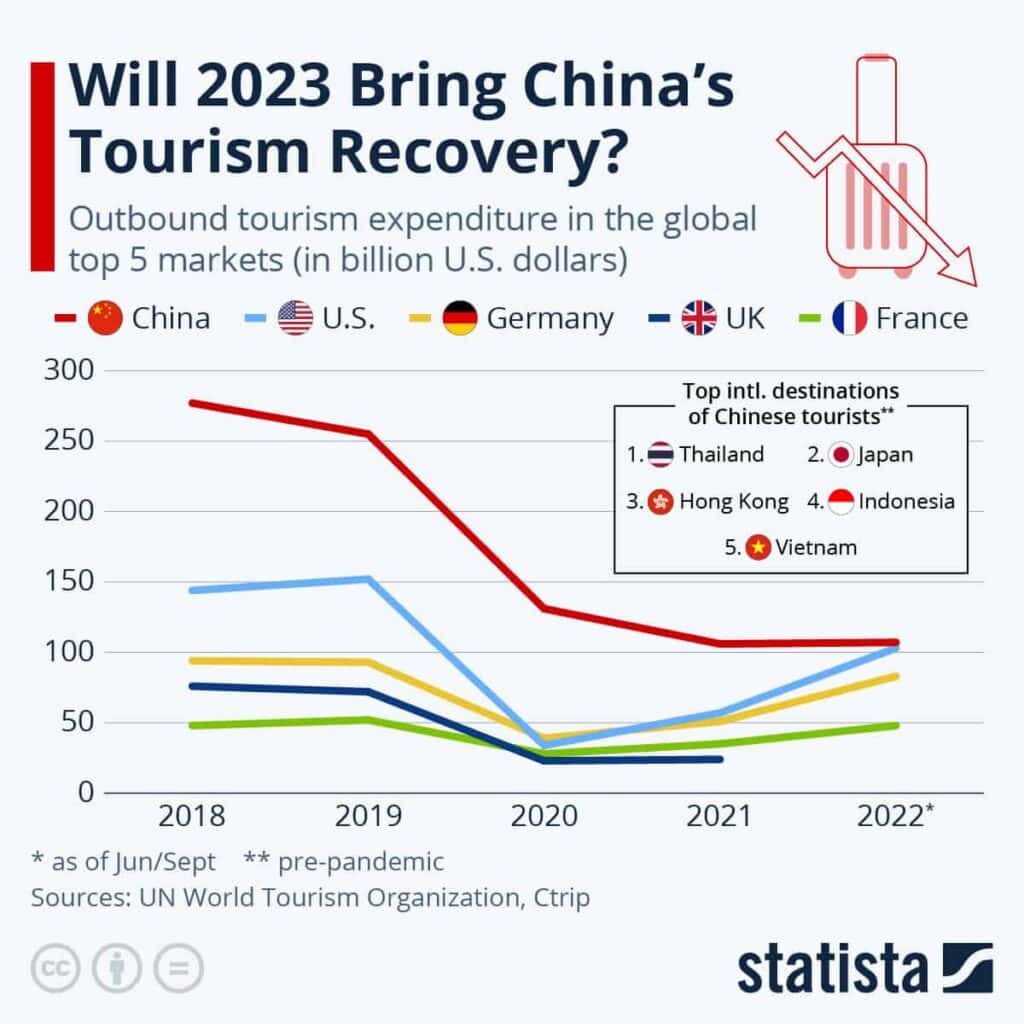
Above you can see how the numbers dropped during the pandemic.
Decreased demand for short-term rentals
During the COVID-19 pandemic, there was a significant decrease in demand for short-term rentals in Airbnb China. This was due to various factors, including travel restrictions and a decline in tourism .
Here you can see a huge drop in Airbnb’s revenue in China in the first quarter of 2020, due to lockdowns and a lack in outbound travel activities among Chinese tourists:

Many people were unable or hesitant to travel during this time, leading to a lower occupancy rate for short-term rental properties . Additionally, the crisis in the short-term rental market resulted in fewer bookings overall .
Listings with shorter rental periods were particularly affected, with some being eliminated completely. As a result of the global impact of the pandemic on Airbnb booking activity, there was a low demand for short-term rentals in general.
Lessons Learned from Airbnb’s Failure in China
Airbnb’s failure in China offers valuable lessons for international companies entering new markets. Understanding the local market and adapting strategies is crucial, as cultural differences and trust issues can significantly impact success.
Moreover, building strong partnerships with local stakeholders, navigating regulatory challenges, and staying updated on laws and policies are essential to long-term viability in foreign markets.
Importance of understanding the local market and adapting strategies
To succeed in a new market like China, it is crucial to understand the local culture and preferences. This means adapting your strategies to meet the specific needs of Chinese consumers.
For example, when Airbnb decided to enter China, it faced challenges because the concept of peer-to-peer accommodation and such room service was unfamiliar to Chinese travelers . It’s important to research and familiarize yourself with the market before launching your product or service.
In addition, building trust with customers and establishing strong partnerships with local stakeholders can help you navigate regulatory challenges and stay updated on local laws and policies.

Building trust and establishing strong partnerships with local stakeholders
In order to succeed in China, it is crucial for Airbnb to build trust and establish strong partnerships with local stakeholders . This means establishing relationships with local communities, gaining the trust of local residents, collaborating with local businesses and organizations, engaging with local government and regulatory agencies, and building a strong network of local hosts and partners.
By understanding the cultural and social dynamics of the market, addressing concerns raised by stakeholders, investing in localized marketing strategies , and respecting local customs and practices, Airbnb can overcome challenges and create a positive brand image in China.
Navigating regulatory challenges and staying updated on local laws and policies
Understanding and complying with local regulations is essential for foreign companies like Airbnb to succeed in China. The country has a complex regulatory landscape , and keeping up with the changing laws and policies can be challenging.
It is important to adapt to the demanding regulatory environment by understanding the cultural context and meeting local market demands. By building strong partnerships with local stakeholders , businesses can navigate these challenges more effectively and increase their chances of success in China’s market.
Ensure Your Brand’s Success with Gentlemen Marketing Agency
The story of Airbnb’s challenges in the domestic business in China underscores the importance of understanding and adapting to the nuances of the local market. For any online travel agency or tourism-based company aspiring to flourish in China, this journey is laden with complexities that require expert navigation.

At Gentlemen Marketing Agency , here’s how we can be your guiding star:
- Deep Local Insight: We dive deep into the intricacies of Chinese consumer behavior, ensuring your brand resonates and connects with the audience effectively.
- Strategic Planning: We don’t just offer solutions; we craft strategies based on your brand’s unique strengths, and the opportunities within the Chinese market.
- Partnership and Collaboration: Our extensive network in China includes key influencers, platforms, and industry leaders. This ensures your brand isn’t just seen, but celebrated.
- Customized Marketing Campaigns: From WeChat to Douyin, our tailored campaigns are designed to garner maximum visibility and engagement for your brand.

Don’t let challenges deter you. With Gentlemen Marketing Agency by your side, craft a success story in China that others will aspire to. Reach out today and chart a course for unparalleled growth and success.

Similar Posts
This is where chinese tourists want to go in 2014.
Top destination for Chinese tourists in 2014! Which countries are among the top 3 for Chinese tourists in 2014? All countries around the world have realized that Chinese people were the new category of tourists they have to attract at all costs, all the more so as everyone know that Chinese are big spenders. That is…

New Zealand Tourism strategy to attract Chinese tourists
New Zealand has been increasing in popularity among Chinese tourists. According to the official New Zealand Tourism website, in 2015, New Zealand attracted more than 350,000 visitors. The number of tourists increased by 34% in 2015 in comparison to 2014. They are also staying longer compared the previous year with an increase of around 70% of…

Record number of Chinese tourists in Spain!
Last year, Spain became the third global holidays destination, after France and the United States. Spain received a record 65 million foreign tourists in 2014. This is the second consecutive year that Spain beats its record of of inbound tourism with 65 million visitors. That means an increase up to 7,1% in comparison with the…

Why you should choose a China based Agency?
A Chinese tourism specialist based outside of China? Hundreds of Agencies around the world present themselves as China specialists. Most of them are based in Europe, North America, Australia or even India (those cheap fake leads providers) They are close to the customer – they meet you every day, drink coffee, they are nice BUT…

Chinese tourists in India: Guide for Pro!
What tour operator and tourism professional should know about India and Chinese tourists? Boost in Tourism and Economic Impact: The reopening to Chinese tourists can lead to a significant boost in tourism for India, benefiting local economies, especially in popular tourist destinations like Goa, Rajasthan, and Kerala. The increase in tourists can help revive sectors…

Chinese tourists in Cameroon: Opportunities for Local Travel Companies
900,000 international tourists visited Cameroon in 2015 Tourism in Cameroon Tourism in Cameroon is a growing industry. Since the 1970s, the government of Cameroon has developed the tourism industry by creating a ministry of tourism and by encouraging investment by airlines, hotels, and travel agencies. “All of Africa in a single Country”, Cameroon is described…
Leave a Reply Cancel reply
Your email address will not be published. Required fields are marked *
Notify me of follow-up comments by email.
Notify me of new posts by email.
Airbnb in China: The Impact of Sharing Economy on Chinese Tourism
- Conference paper
- First Online: 14 June 2017
- Cite this conference paper

- Yumeng Bie 17 ,
- Jieyu Wang 17 &
- Jingyu Wang 18
Part of the book series: Advances in Intelligent Systems and Computing ((AISC,volume 594))
Included in the following conference series:
- International Conference on Applied Human Factors and Ergonomics
2960 Accesses
1 Citations
Today an increasing number of young people are likely to book homestay hotels instead of traditional hotels. We find Airbnb is one of the most popular websites in China to reserve homestays for young people traveling aboard. Since the company’s headquarters is based in San Francisco, we find it is not well-known in China and little research has been done about it in China. Therefore, this paper addresses how Airbnb can influence Chinese tourism. We use mixed methods in this paper, including surveys, interviews and ethnography studies. We conduct semi-structured interviews to travelers and Airbnb employees. We carry out surveys to participants. The surveys have been posted both on the internet and in print. Ethnography studies have been conducted in order to get detailed information about customers’ usage of the website. We find that 59.05% of the participants prefer to live in starred hotels, and 49.52% of the participants prefer to stay in budget hotels and 18.1% of the participants used Airbnb. We find out that interviewees believe that the emerging of sharing economy like Airbnb does influence or will impact the traditional hotel industry. Some participants expressed their preferences about the website design and the work environment of Airbnb. Our ethnography studies also investigated four Airbnb customers’ travel experiences about using Airbnb website. They reported that Airbnb not only offered them diverse rooms, but also offered them good accommodation, lots of travel information and help from landlords. However, trust issue still is a big concern between customers and Airbnb.
This is a preview of subscription content, log in via an institution to check access.
Access this chapter
Subscribe and save.
- Get 10 units per month
- Download Article/Chapter or Ebook
- 1 Unit = 1 Article or 1 Chapter
- Cancel anytime
- Available as PDF
- Read on any device
- Instant download
- Own it forever
- Available as EPUB and PDF
- Compact, lightweight edition
- Dispatched in 3 to 5 business days
- Free shipping worldwide - see info
Tax calculation will be finalised at checkout
Purchases are for personal use only
Institutional subscriptions
Shaping the Consumers Behavior Who Are Using Airbnb—The Case of Airbnb’s Users in Greece
When harry met sally: different approaches towards uber and airbnb—an australian and singapore perspective.

Northern Portugal Tourism Experiences Management for the Post-Covid Period: Facing Demand Changes in Tourism Products and Services
Byers, J.W., Esposito, F., Proserpio, D., Zervas, G. The hyper-local economic impact of Airbnb. In: 9th Symposium on Statistical Challenges in eCommerce Research, Lisbon, Portugal (2013)
Google Scholar
Fradkin, A., Grewal, E., Holtz, D., Pearson, M.: Bias and reciprocity in online reviews: evidence from field experiments on Airbnb. In: 18th ACM Conference Companion on Computer Supported Cooperative Work and Social Computing, pp. 219–222. ACM, New York (2015)
Lee, D., Hyun, W., Ryu, J., Lee, W.J., Rhee, W., Suh, B.: An analysis of social features associated with room sales of Airbnb. In: 16th ACM Conference on Economics and Computation, pp. 641–641. ACM, New York (2015)
Ma, X., Hancock, J.T., Mingjie, K.L., Naaman, M.: Self-disclosure and perceived trustworthiness of Airbnb host profiles. In: 20th ACM Conference on Computer Supported Cooperative Work and Social Computing, pp. 2397–2409. ACM, New York (2017)
Zervas, G., Proserpio, D., Byers, J.W.: The impact of the sharing economy on the hotel industry: evidence from Airbnb’s entry into the Texas market. In: 16th ACM Conference on Economics and Computation, pp. 637–637. ACM, New York (2015)
Download references
Acknowledgments
We thank our participants for their participation and contribution.
Author information
Authors and affiliations.
International College Beijing, University of Colorado Denver, Beijing, 100083, China
Yumeng Bie & Jieyu Wang
Haidian Huanyuan Road 5, Beijing, 100088, China
Jingyu Wang
You can also search for this author in PubMed Google Scholar
Corresponding author
Correspondence to Jieyu Wang .
Editor information
Editors and affiliations.
Belgafik Oy, University of Vaasa, Vaasa, Finland
Jussi Ilari Kantola
University of Szeged, Szeged, Hungary
Tibor Barath
Institute of Maritime Operations, University College of Southeast Norway, Borre, Norway
Salman Nazir
Rights and permissions
Reprints and permissions
Copyright information
© 2018 Springer International Publishing AG
About this paper
Cite this paper.
Bie, Y., Wang, J., Wang, J. (2018). Airbnb in China: The Impact of Sharing Economy on Chinese Tourism. In: Kantola, J., Barath, T., Nazir, S. (eds) Advances in Human Factors, Business Management and Leadership. AHFE 2017. Advances in Intelligent Systems and Computing, vol 594. Springer, Cham. https://doi.org/10.1007/978-3-319-60372-8_2
Download citation
DOI : https://doi.org/10.1007/978-3-319-60372-8_2
Published : 14 June 2017
Publisher Name : Springer, Cham
Print ISBN : 978-3-319-60371-1
Online ISBN : 978-3-319-60372-8
eBook Packages : Engineering Engineering (R0)
Share this paper
Anyone you share the following link with will be able to read this content:
Sorry, a shareable link is not currently available for this article.
Provided by the Springer Nature SharedIt content-sharing initiative
- Publish with us
Policies and ethics
- Find a journal
- Track your research
Airbnb China closes domestic unit to cut costs as it bets on border reopening

Airbnb will terminate its domestic business in China, marking the partial retreat of another Western tech giant from the country.
Like most of its peers, the home sharing titan is shifting its focus to China’s outbound business. Google, Facebook, Twitter and the likes don’t offer services to Chinese consumers but they are important advertising channels for the country’s booming export-oriented e-commerce sellers.
Airbnb is closing down its domestic home and experiences segments in China this summer and pivoting to serve the country’s growing appetite for outbound tourism, according to a person familiar with the matter.
The American company had high hopes when it entered China in 2016. It was once a popular choice for foreign tourists and Western-educated Chinese traveling in the country. But that population is in the minority after all. Over the years Airbnb has faced rising competition from domestic rivals like Tujia, backed by its own investor , and experienced several management shakeups at the top.
With China’s tourism disrupted by intermittent lockdowns since 2020 “with no end in sight,” Airbnb decided to it was time to end the business. “The domestic segment is costly and complex to operate, and COVID-19 worsened these issues and heightened their impact,” the person with knowledge said.
Since 2016, Airbnb’s China listings have logged 25 million guest arrivals, but stays in China have accounted for just about 1% of the firm’s revenue for the last few years. The company will remove roughly 150,000 listings in China as part of the shutdown, reported The New York Times .
Airbnb is betting on the opportunity to meet China’s pent-up demand for outbound tourism once the country loosens travel restrictions. Nearly 155 million Chinese people traveled abroad in 2019, compared to just 48 million a decade ago, according to data compiled by World Bank.
But it might still be a long time before Airbnb gets to experiment with this new endeavor. China is one of the last countries to have stuck to strict COVID-19 border rules , limiting outbound and inbound travel. The country’s economy is also projected to slow , which could continue to hurt consumer confidence even after the borders reopen.
The long haul of Microsoft’s China localization
More TechCrunch
Get the industry’s biggest tech news, techcrunch daily news.
Every weekday and Sunday, you can get the best of TechCrunch’s coverage.
Startups Weekly
Startups are the core of TechCrunch, so get our best coverage delivered weekly.
TechCrunch Fintech
The latest Fintech news and analysis, delivered every Tuesday.
TechCrunch Mobility
TechCrunch Mobility is your destination for transportation news and insight.
Presti is using GenAI to replace costly furniture industry photo shoots
If you’ve ever bought a sofa online, have you thought about the homes you can see in the background of the product shots? When it’s time to release a new…

Google backs Indian open-source Uber rival
Google has joined investors backing Moving Tech, the parent firm of open-source ride-sharing app Namma Yatri in India that is eroding market share from Uber and Ola with its no-commission…

At last, Apple’s Messages app will support RCS and scheduling texts
These messaging features, announced at WWDC 2024, will have a significant impact on how people communicate every day.

Here are all the devices compatible with iOS 18
iOS 18 will be available in the fall as a free software update.

TikTok glitch allows Shop to appear to users under 18, despite adults-only policy
The tests indicate there are loopholes in TikTok’s ability to apply its parental controls and policies effectively in a situation where the teen user originally lied about their age, as…

Lhoopa raises $80M to spur more affordable housing in the Philippines
Lhoopa has raised $80 million to address the lack of affordable housing in Southeast Asian markets, starting with the Philippines.

Trump’s VP candidate JD Vance has long ties to Silicon Valley, and was a VC himself
Former President Donald Trump picked Ohio Senator J.D. Vance as his running mate on Monday, as he runs to reclaim the office he lost to President Joe Biden in 2020.…

TechCrunch Space: Space cowboys
Hello and welcome back to TechCrunch Space. Is it just me, or is the news cycle only accelerating this summer?!
Without Apple Intelligence, iOS 18 beta feels like a TV show that’s waiting for the finale
Apple Intelligence features are not available in the developer beta, which is out now.

Apple’s public betas for iOS 18 are here to test out
Apple released the public betas for its next generation of software on the iPhone, Mac, iPad and Apple Watch on Monday. You can now test out iOS 18 and many…

Fisker has one major objector to its Ocean SUV fire sale
One major dissenter threatens to upend Fisker’s apparent best chance at offloading its unsold EVs, a deal that would keep the startup’s bankruptcy proceeding alive and pave the way for…

Major Stripe investor Sequoia confirms $70B valuation, offers its investors a payday
Payments giant Stripe has delayed going public for so long that its major investor Sequoia Capital is getting creative to offer returns to its limited partners. The venture firm emailed…

Google’s Kurian approached Wiz, $23B deal could take a week to land, source says
Alphabet, Google’s parent company, is in advanced talks to acquire Wiz for $23 billion, a person close to the company told TechCrunch. The deal discussions were previously reported by The…

Bird Buddy’s new AI feature lets people name and identify individual birds
Name That Bird determines individual members of a species by identifying distinguishing characteristics that most humans would be hard-pressed to spot.

YouTube Music is testing an AI-generated radio feature and adding a song recognition tool
YouTube Music is introducing two new ways to boost song discovery on its platform. YouTube announced on Monday that it’s experimenting with an AI-generated conversational radio feature, and rolling out…
Elon Musk confirms Tesla ‘robotaxi’ event delayed due to design change
Tesla had internally planned to build the dedicated robotaxi and the $25,000 car, often referred to as the Model 2, on the same platform.

Moon cave! Discovery could redirect lunar colony and startup plays
What this means for the space industry is that theory has become reality: The possibility of designing a habitation within a lunar tunnel is a reasonable proposition.

Disrupt Deal Days are here: Prime savings for TechCrunch Disrupt 2024!
Get ready for a prime week of savings at TechCrunch Disrupt 2024 with the launch of Disrupt Deal Days! From now to July 19 at 11:59 p.m. PT, we’re going…

Deezer chases Spotify and Amazon Music with its own AI playlist generator
Deezer is the latest music streaming app to introduce an AI playlist feature. The company announced on Monday that a select number of paid users will be able to create…

Caliza lands $8.5 million to bring real-time money transfers to Latin America using USDC
Real-time payments are becoming commonplace for individuals and businesses, but not yet for cross-border transactions. That’s what Caliza is hoping to change, starting with Latin America. Founded in 2021 by…

Adaptive builds automation tools to speed up construction payments
Adaptive is a platform that provides tools designed to simplify payments and accounting for general construction contractors.

How VanMoof’s new owners plan to win over its old customers
When VanMoof declared bankruptcy last year, it left around 5,000 customers who had preordered e-bikes in the lurch. Now VanMoof is up and running under new management, and the company’s…

Mitti Labs aims to make rice farming less harmful to the climate, starting in India
Mitti Labs aims to transform rice farming in India and other South Asian markets by reducing methane emissions by 50% and water consumption by 30%.

How to tell if your online accounts have been hacked
This is a guide on how to check whether someone compromised your online accounts.

The AI financial results paradox
There is a general consensus today that generative AI is going to transform business in a profound way, and companies and individuals who don’t get on board will be quickly…

Google reportedly in talks to acquire cloud security company Wiz for $23B
Google’s parent company Alphabet might be on the verge of making its biggest acquisition ever. The Wall Street Journal reports that Alphabet is in advanced talks to acquire Wiz for…

Featured Article
Hank Green reckons with the power — and the powerlessness — of the creator
Hank Green has had a while to think about how social media has changed us. He started making YouTube videos in 2007 with his brother, novelist John Green, at a time when the first iPhone was in development, Myspace was still relevant and Instagram didn’t exist. Seventeen years later, posting…

Synapse’s collapse has frozen nearly $160M from fintech users — here’s how it happened
Here is a timeline of Synapse’s troubles and the ongoing impact it is having on banking consumers.

Helixx wants to bring fast-food economics and Netflix pricing to EVs
When Helixx co-founder and CEO Steve Pegg looks at Daisy — the startup’s 3D-printed prototype delivery van — he sees a second chance. And he’s pulling inspiration from McDonald’s to get there. The prototype, which made its global debut this week at the Goodwood Festival of Speed, is an interesting proof…

India clings to cheap feature phones as brands struggle to tap new smartphone buyers
India is struggling to get new smartphone buyers, as millions of Indians don’t go for an upgrade and continue to be on feature phones.

Click through the PLOS taxonomy to find articles in your field.
For more information about PLOS Subject Areas, click here .
Loading metrics
Open Access
Peer-reviewed
Research Article
Characteristics and influencing factors of Airbnb spatial distribution in China’s rapid urbanization process: A case study of Nanjing
Roles Conceptualization, Funding acquisition, Methodology, Project administration, Supervision, Writing – review & editing
* E-mail: [email protected]
Affiliation School of Architecture, Southeast University, Nanjing, Jiangsu, China
Roles Conceptualization, Data curation, Formal analysis, Investigation, Methodology, Resources, Software, Validation, Visualization, Writing – original draft
Affiliation Jiangsu Institute of Urban Planning and Design, Nanjing, Jiangsu, China
Roles Data curation, Formal analysis, Investigation, Resources, Software, Validation, Visualization, Writing – review & editing
- Shijie Sun,
- Shengyue Zhang,
- Xingjian Wang
- Published: March 18, 2021
- https://doi.org/10.1371/journal.pone.0248647
- Reader Comments
As in other countries, short-term rentals for tourism services are growing rapidly in China’s tourist cities, which are mainly operated through Airbnb. This paper explores whether the spatial distribution of Airbnb in China’s rapid urbanization process exhibits characteristics, paths, and drivers that are different from those of cities in other countries. Airbnb is a model for the global sharing economy, but it is increasingly influenced by other functions and facilities in cities as it grows. In this paper, the zero-expansion negative binomial regression was used to study the factors affecting the spatial distribution of Airbnb in Nanjing, China. The results showed that the spatial distribution of Airbnb listings was correlated with the distribution of cultural attractions, universities, public transport accessibility, shopping centers, and business apartments. By analyzing the driving forces of Airbnb’s development in Nanjing, this paper found that a large number of business apartments developed in cities were essential providers of Airbnb listings, and affected its spatial distribution. The gap between short-term and long-term rentals was also correlated with the distribution of Airbnb. In addition, similar to the previous literature findings, the increase in the proportion of professional hosts changes the original intention of Airbnb for sharing and communication. Our empirical results applies to the current situation of Airbnb in Chinese cities, which is conducive to the government’s more intelligent management and effective promotion of the Airbnb market. Our findings also provide positive references for urban renewal policies and public participation methods in China.
Citation: Sun S, Zhang S, Wang X (2021) Characteristics and influencing factors of Airbnb spatial distribution in China’s rapid urbanization process: A case study of Nanjing. PLoS ONE 16(3): e0248647. https://doi.org/10.1371/journal.pone.0248647
Editor: Jun Yang, Northeastern University (Shenyang China), CHINA
Received: December 17, 2020; Accepted: March 3, 2021; Published: March 18, 2021
Copyright: © 2021 Sun et al. This is an open access article distributed under the terms of the Creative Commons Attribution License , which permits unrestricted use, distribution, and reproduction in any medium, provided the original author and source are credited.
Data Availability: All relevant data are within the manuscript and its Supporting Information files.
Funding: This work was supported by the National Natural Science Foundation of China. Grant Number:51678130. The funders had no role in study design, data collection and analysis, decision to publish, or preparation of the manuscript.
Competing interests: The authors have declared that no competing interests exist.
Introduction
The attractive concept of sharing accommodation represented by Airbnb has raised the attention of scholars. Founded in 2008, Airbnb has covered 65,000 cities worldwide by 2017, becoming the largest accommodation sharing platform in the world. Researchers analyzed the impact of Airbnb on the traditional hotel business [ 1 – 3 ] and housing [ 4 – 6 ]. Some studies believe that the rapid growth of Airbnb may bring community problems and promote gentrification of tourism [ 4 , 7 – 9 ]. Therefore they also discuss the management of Airbnb [ 7 , 10 ]. In recent years, researchers have studied the spatial distribution characteristics of some cities considering the potential economic, social, and cultural impacts that Airbnb might have on communities. These studies showed that the distribution of Airbnb listing was related to city centers, major attractions, and transport accessibility [ 11 , 12 ].
In China, the construction of transportation infrastructure over the last two decades has greatly contributed to the tourism boom [ 13 , 14 ], and the growth of shared urban accommodation has followed. According to the “Report on The Development of Shared Accommodation in China (2018)”, the transaction volume of shared accommodation in 2017 was around 14.5 billion yuan, which increased 70.6 percent compared to the previous year, and the number of domestic listings on major shared accommodation platforms was about 3 million. Airbnb officially entered the Chinese market in 2015 and expanded rapidly. In 2019, the web visits of Airbnb exceeded that of other accommodation-sharing platforms in China. In Nanjing, the selected site of this study, Airbnb has more short-term rental listings than its competitors. However, few studies discussed the correlation between it and urban elements. In particular, although Airbnb in China develops rapidly, there are gaps in the research of spatial distribution characteristics, and there is a lack of discussion on the spatial growth mechanism behind it. The above problems resulted in scholars have an insufficient understanding of the spatial growth characteristics of Airbnb in China.
Therefore, Airbnb’s spatial distribution characteristics and growth mechanism need to be better understood to deal with various related urban issues. This paper analyzes the spatial distribution characteristics of Airbnb in the central regions of Nanjing and tries to find the correlation between the distribution of listing and other characters of the city. The goal is to answer the following questions: What are the characteristics of the spatial distribution of Airbnb in Nanjing city? What factors determine the distribution and expansion of Airbnb? Answering these questions will help urban planners and policymakers deal with the problems caused by the proliferation of Airbnb in the urban renewal process.
Literature review
The influences of airbnb.
Some studies showed that the rapid growth of Airbnb might bring negative impacts on communities, including the increasing housing rental costs, social conflicts, security problems, and noise [ 6 , 7 , 15 ]. The most important one is that the rapid increase of Airbnb listings may lead to the rise in housing costs [ 16 , 17 ]. A study of Boston found that the rental price increases by 0.4% when Airbnb listings increase one standard deviation [ 6 ]. According to Gurran and Phibbs (2017) ’s study of Sydney, it is found that Airbnb may cause community problems such as noise, congestion, and reduction of long-term rentable housing [ 7 ]. Cocola-gant and Gago (2019) tracked the Alfma community in Lisbon and found that the gentrification process experienced by the residents was an unfair social process [ 18 ]. In addition, it has been shown in many studies that the negative impact of Airbnb is geographically unbalanced [ 19 ]. The study of Gutierrez et al. (2017) about the spatial distribution of shared home-stays and hotels in Barcelona illustrated that home-stays are mainly clustered in the areas of city centers or famous tourist attractions, posing new challenges to the harmonious coexistence of local communities [ 20 ].
Airbnb and rental gap
There are two main reasons for the negative impact of Airbnb. First, many Airbnb listings are located in residential areas where tourism infrastructure and carrying capacity are limited and insufficient. Therefore, Airbnb listings may cause tourism-oriented pressure in residential areas [ 7 ]. Furthermore, although the original intention of Airbnb is to make use of unused space, some houses are only used as Airbnb houses, most of which are downtown apartments rather than real empty ones, which may reduce the supply of long-rented listing [ 4 , 5 , 8 ]. Many researchers are in agreement that the rent gap between the long-term and short-term rental was the mainspring of convert leasing into an Airbnb. According to a study of New York City, Wachsmuth and Weisler (2018) cited and reconstructed the model of rent gap raised by Neil Smith. They claimed that the potential rental was raised by Airbnb listing, which widened the rent gap and eventually led to gentrification [ 4 ]. Smith’s classical rent gap theory holds that with the depreciation of buildings, the "actual rental" will gradually decline. In contrast, the "potential rental" will keep increasing, which forms the ever-expanding "rent difference" between the two. When the difference expands to meet the revenue expectation of capital, the structural incentive of capital reinvestment begins to appear, and it is easy to get gentrified [ 21 ]. Nonetheless, the rent gap brought by Airbnb may not accompany the redevelopment of cities, but rapidly increase the potential rental through short-term renting. Yrigoy (2018) also believed that the rent gap between short-term and long-term rental drive the landlord to convert the long-term rentals into the short-term ones, which resulted in the drop in the stock of rental housing in tourist cities and tourism gentrification [ 8 ]. Similarly, such a rent gap has become the main driving force of Airbnb’s expansion in China.
Professional hosts of Airbnb
Professional hosts are the most controversial topic in the study of Airbnb. Numbers of international studies believe the professional hosts operating two or more Airbnb units are the main beneficiaries of Airbnb and may lead to a decrease in the number of long-term rental listings [ 6 , 22 – 24 ]. According to Horn and Merante’s study, a host that operated more than two Airbnb apartments was defined as a professional host [ 6 ]. Murry, from Inside Airbnb, also defined a landlord who owned two or more houses as a professional host. Wachsmuth et al. (2017) defined the “triple threat” to Airbnb, including full-time listing, entire house properties, and multi-listing hosts (professional hosts) [ 23 ]. He defined a professional host more strictly, thinking that only a landlord with two or more full-house listings or three and more single-room listings could be considered as a professional host. He conducted researches on three cities in Canada and found that Airbnb listings cut down the number of long-term rental housing in the cities, and professional hosts were the main threat. Professional host is also a trending topic in China. According to the investigation of "2019 Urban Home Stay Entrepreneur Data Report", the average operating time of housing supply was about 0.5 hours, while the average time spent of 20 to 30 housing units would drop to about 0.1 hours per unit. Marginal costs were significantly lower, but revenues were higher, so hosts would expand or join escrow companies. In China, professional hosts and hosting companies are the mainstays of Airbnb’s operation. Professional hosts have led to disputes about pushing up rents and whether to reduce the sharing attributes of Airbnb.
Spatial distribution of Airbnb
Studies on the spatial distribution characteristics of Airbnb mainly focued on the relationship between the distribution of Airbnb listings and the other factors, such as built environment, functional structure, and demographic characteristics of urban space [ 25 – 28 ]. Gutierrez et al. (2017) found a close spatial relationship between Airbnb and hotels through a case analysis of Barcelona, and it showed a clear central-peripheral pattern. Airbnb listings were mainly concentrated in the central area, which was related to the number of leisure and restaurants nearby, covering a wider area than the main axis of the hotel [ 20 ]. Comparing with the hotel industry, Airbnb took advantage of major tourist attractions in nearby cities and extended to residential areas in the city center, bringing tourism pressure into residential areas. Quattrone et al. (2016) analyzed the distribution of Airbnb apartments in London from 2012 to 2015. They assumed that a specific group would profit from Airbnb. The analysis showed that the homeownership rate was negatively correlated with the number of Airbnb apartments. The finding suggested that landlords make money from Airbnb by renting their houses rather than owning them [ 25 ]. In the analysis of the spatial distribution of Airbnb in Seoul, South Korea, Ki and Lee (2019) used the negative binaries regression model to test the factors influencing Airbnb’s location characteristics. The study showed that Airbnb’s units preferred to be located in areas near universities or subway stations, as well as areas with a high proportion of single families [ 12 ]. Xu et al. (2017), used the least-squares method and geographically weighted regression to study the distributive characteristics of Airbnb in London. They believed that the shared accommodation was mainly concentrated in the city center and the surrounding area of tourist attractions. Furthermore, the surrounding environmental factors, such as water, vegetation, universities, arts & human landscape, transport, and nightlife spots, were the significant factors that were affecting the spatial distribution of Airbnb [ 11 ]. In general, the above studies all agreed that the distribution of Airbnb listing was correlated with city centers, important scenic spots, and urban environmental elements.
This study used the research methods of Ki and Lee (2019) and Xu et al. (2017) [ 11 , 12 ] to study the spatial distribution of Airbnb in Nanjing, but the major contribution of this work was to further highlight the coupling relationship with the urban spatial structure. At the same time, it studied the driving factors of Airbnb’s development from the aspects of urban development and housing source, professional hosts, and rent gap.
Data and methods
This study chose Nanjing as an example. Nanjing is a famous tourist city in China, the capital of Jiangsu Province, and one of the important central cities in east China, with a total population of about 8.5 million. Over the past three years, the number of Airbnb listings in Nanjing has increased nearly tenfold. It has been repeatedly reported by the news that there are various community problems caused by Airbnb, such as noise, fire risk, and safety problems.
The central region of Nanjing was selected as the research area, with a total area of about 295 km². The primary reasons for the choice are as follows: ①The Airbnb listings in the city are mainly concentrated within the main city of Nanjing, with a small number of suburbs; ②The central Nanjing is an area where important facilities gather. The built environment is relatively mature, and the influencing factors on the aggregation and distribution of Airbnb listings are more complex. The analysis of this area is helpful in exploring the distribution characteristics of Airbnb listings in Nanjing. The time range of the study is from July 2016 to October 2019.
Variables and data collection
This Airbnb source data were derived from AirDNA, a third-party data platform, and were composed of the monthly data of Airbnb in Nanjing from 2016 to 2019, including the listing ID, type, location, price, income, booking status, and the host’s ID.
In current studies, factors related to housing distribution include urban centers [ 18 , 24 , 29 ], cultural attractions [ 11 ], and traffic accessibility [ 30 , 31 ], service facilities [ 11 ], etc. Based on the characteristics of Nanjing, this study selected seven urban environmental factors, including subway stations, bus stops, cultural attractions, universities, shopping malls, living facilities, business apartments as independent variables for the study of the spatial distribution of Airbnb listings. The POI data of these independent variables were obtained from AMap, one of the largest mobile map and life service websites in China. The POI data types, acquisition methods, and quantities are shown in Table 1 .
- PPT PowerPoint slide
- PNG larger image
- TIFF original image
https://doi.org/10.1371/journal.pone.0248647.t001
Traffic accessibility is a major factor affecting the distribution of Airbnb listings [ 32 , 33 ]. Nanjing has the fourth-longest metro network in China. Therefore, subway travel has become a common choice for tourists. Nanjing is also famous for its well-developed bus transportation system, which is also a common mode of transportation for tourists.
Nanjing is an internationally well-known tourist city with rich cultural and historical resources. As an emerging way of travel and consumption, Airbnb may have a correlation between its spatial distribution and cultural attractions. Additionally, Nanjing is one of the cities of China that has the largest number of universities and is nationally known for the historical and cultural values and beautiful campuses, including Nanjing University, Southeast University, and Nanjing Normal University, which are also popular tourist attractions. Thus, Airbnb listing distribution may be related to the colleges and universities locations partly.
Because Airbnb guests are more willing to explore and experience local daily lives and communities, restaurants and life service facilities may also affect the spatial distribution of Airbnb listings. Since shopping spaces in city centers are often important destinations for visitors, the layout of large shopping malls may also have an impact on Airbnb’s distribution.
According to the preliminary analysis of Airbnb housing source data, the proportion of business apartment type housing source is always high. Therefore, business apartments are listed as an independent variable in this study. From the perspective of housing types, the main sources of Airbnb listings in Nanjing city are mainly business apartment, condominium, and service apartment, among which the proportion of business apartment is up to 50% ( Table 2 ), which may have a great impact on the distribution of Airbnb.
https://doi.org/10.1371/journal.pone.0248647.t002
In order to quantify the spatial distribution characteristics of Airbnb more conveniently, this study divided the research scope (the central Nanjing) into 177 grids with a size of 1500m*1500m each. The number of Airbnb in each grid was defined as the dependent variable Y ( Fig 1 ) and was calculated using Arcgis. And the distance from the center of the grid to the nearest subway station, cultural attractions, shopping malls, and universities were defined as independent variables X1-X4, while the number of bus stops, business apartments, and living facilities in each grid were defined as independent variables X5-X7 respectively. In addition, the urban construction area and non-construction area were distinguished through analyzing the satellite remote sensing images of the main city of Nanjing. In Arcgis, the percentage of construction area in each grid was calculated as the independent variable X8.
The central Nanjing was divided into 177 grids.
https://doi.org/10.1371/journal.pone.0248647.g001
For count data such as the dependent variable in this study, negative binomial regression and Poisson regression are commonly used, in which the Poisson model is applicable to the case where the sample conforms to the Poisson distribution (i.e., expectation equals variance), while the negative binomial regression is applicable to the processing of data that is too discrete. In addition, when there are too many zero values in the sample data, zero-expansion Poisson regression or zero-expansion negative binomial regression should also be considered. In this study, ordinary Poisson regression, negative binomial regression, and zero-expansion negative binomial regression were used to process the data, respectively. After examining their results, zero-expansion negative binomial regression was selected as the most suitable model to analyze the data and obtained the variables with significant influence. Then, GIS was used to analyze the spatial relationship between the distribution of Airbnb housing source and urban built environment elements in order to discuss the coupling relationship between the location of Airbnb and urban structure.
General distribution and agglomeration trends
Based on the change of Airbnb’s listing distribution from 2016 to 2019 ( Fig 2 ), in 2016, the second year Airbnb entered China, the number of listing in central Nanjing is relatively small, and the locations are scattered, mainly distributed near the main scenic spots like Confucius Temple and Xuanwu Lake, without any cluster. Since 2017, housing sources have gradually gathered around Xuanwu Lake, Confucius Temple, and other important scenic spots, especially in the surrounding area of Confucius Temple. The Xinjiekou area has also begun to show the characteristics of agglomeration. In 2018, the number of listings increased rapidly, forming a central cluster in Xinjiekou—Confucius Temple area. By 2019, the distribution of Airbnb listings in the main urban area of Nanjing shows obviously clustering characteristics, including central clustering on the whole and "hallway-type" layout along with the rail transit on the periphery. In general, Airbnb listings in central Nanjing have grown very rapidly, and they have undergone a process of change from scattered locations to obvious clusters. From 2016 to 2019, in view of Airbnb listing spatial distribution, there is a certain regularity in its spread. The Airbnb space distribution in Nanjing can be summarized as four stages, namely the urban humanities scenic area, commercial center, transportation hub, and dispersive phase of development.
https://doi.org/10.1371/journal.pone.0248647.g002
Analysis of variables
Since the data of dependent variable Y (that is, the number of Airbnb in each grid) were a non-negative integer, the Poisson model was first considered for analysis. However, by statistical analysis of the dependent variable, it was found that its variance was 35066.28, far higher than its mean value of 70.75, which did not follow the assumption of Poisson model. Therefore, negative binomial regression was considered to be used for analysis. Results of negative binomial regression analysis conducted in Stata showed that the LR test results of alpha = 0 were: chibar2(01) = 9432.36, Prob> = chibar2 = 0.000, which indicated that the dependent variables in this study were overdispersed, not conforming to the assumption of Poisson distribution. Therefore, negative binomial regression should be used for analysis.
Because the dependent variable Y had a large number of zero values (27 out of 177 are zero values), negative binomial regression analysis with zero expansion was considered. Through observation of the grid distribution with the number of Airbnb was 0, it was found that most of them were located in areas with a large proportion of non-construction lands, such as forest land and water area. Therefore, the proportion of urban construction land in each grid was introduced as an expansion variable, and zero expansion negative binomial regression analysis was carried out in Stata. Vuong test showed that z = 1.71 Pr>z = 0.0440. Therefore, compared with ordinary negative binomial regression, it was more reasonable to select zero expansion negative binomial regression analysis.
Before regression analysis, the variance inflation factor test was performed on the independent variables. Variance inflation factor (VIF) of all the independent variables was less than 5 ( Table 3 ), indicating that there was no multicollinearity, which confirmed the quality of the further analysis.
https://doi.org/10.1371/journal.pone.0248647.t003
Then, zero-inflation negative binomial regression was conducted in Stata. The expansion variable was x8 (the percentage of the construction area in the grid) ( Table 4 ). The results show that the P values of seven among all eight variables, namely x1, x2, x3, x4, x5, x6, and x8, were all less than 0.1, which were statistically significant. The correlation coefficient of x1, x2, x3, and x4 was negative, indicating that they were negatively correlated with the number of Airbnb in the grid. In other words, the closer the center of the grid was to the subway station, shopping center, university and scenic spot, the greater the number of Airbnb is. The correlation coefficient of the number of x5 and x6 was positive, indicating that they were positively correlated with the number of Airbnb in the grid. This result suggests a larger number of Airbnb in places with more business apartments and bus stops.
https://doi.org/10.1371/journal.pone.0248647.t004
Tourist attractions.
First, Airbnb distribution is related to tourist attractions. This conclusion is similar to many studies. This research established a buffer zone of 1000m and 1500m for the main attractions in central Nanjing and counted the number of Airbnb listings. In the planar scenic spots like Xuanwu Lake and Purple Mountain, the edge created the planar buffer zone outward. In other small scenic spots, the circular buffer zone with the center of the scenic spot as the center of the circle was created. According to the statistics of the buffer zones, 9560 houses were distributed within the area of 1500m, accounting for 78%. 6,200 listings were in the buffer zone of 1000m, accounting for 51%. Among them, Confucius Temple, a historical and cultural scenic spot, had the strongest agglomeration effect on Airbnb, and together with Xinjiekou, the city center forms the core of Airbnb housing agglomeration.
Commercial and amenities.
The rapid urban development in Nanjing since the 2000s results in the equalization in the spatial layout of community living facilities and almost all Airbnb locations were having convenient and adequate amenities, which is a possible reason that the correlation between the distribution of Airbnb listings and amenities did not pass the test. However, shopping malls in Nanjing are usually located in the main business centers of the city. The analysis results showed that the distribution of Airbnb houses was positively correlated with the layout of shopping centers, which might suggest that urban business center is an important factor affecting the distribution of Airbnb.
Transportation accessibility.
The accessibility of urban rail transit is an important factor in explaining the clusters of Airbnb listings in Nanjing. According to statistics, the number of Airbnb listings within 500m from the subway station was 7321, accounting for 59.8% of the total in central Nanjing, while the number of listings within 1000m was 10,870, accounting for 80% ( Fig 3 ). Therefore, the majority of short rent houses were clustered within walking distance of subway stations (1000m).
https://doi.org/10.1371/journal.pone.0248647.g003
In order to understand the relationship between the number of Airbnb listings and the distance to subway stations, the nearest neighbor analysis tool in ArcGIS was used to find the distance between each listing point and the nearest subway station, and then aggregated them to generate scatter-distribution maps [ 12 ]. As shown in the scatter plot of the number and distance of Airbnb listings ( Fig 4 ), there was an evident curve relationship between them, and the overall distribution was skewed, forming a U-shaped curve. In general, the closest distance between most Airbnb listings and subway stations was within 0-1000m. By analyzing this U-shaped curve, we found that listings within 500m of the subway station showed a linear upward trend, reaching a peak value around 338m, and then a linear downward trend. The prime cause is that most of the land around the subway station was used for other public functions. In most cases, a large number of commercial and residential buildings or residential buildings existed within the 300-500m range. Therefore, there was a significant upward trend within this range. After the maximum threshold of 338m, there was a downward curve because away from the subway station, the fewer the number of Airbnb was listed.
https://doi.org/10.1371/journal.pone.0248647.g004
Most of the domestic and foreign tourists arrive in Nanjing from two railway stations, the Nanjing railway station, and the Nanjing south railway station. In this study, the buffer analysis of 500m and 1000m radius was done on the three nearest subway stations from Nanjing south railway station and Nanjing railway station, respectively. The results showed that the average of listings within 1000m to subway stations around Nanjing south railway station reached an average of 483, which was higher than the 303 at Nanjing railway station and higher than the average level of 149 at Nanjing urban subway stations. Accordingly, it suggests that “the convenience of rail transit to major high-speed rail stations” had a distinctly positive effect on the agglomeration of Airbnb listings.
Business apartments.
The development speed of many large cities in China is still at a relatively high level, especially driven by the high-speed railway infrastructure and the developments of new areas. In city centers and new towns, a large number of business apartments and service apartments are often built, resulting in a high vacancy rate due to the lack of market demand. In China, the land use of business apartments and service apartments is commercial rather than residential, with a 40-year property right rather than 70 years. Therefore, they are more suitable to be transformed into Airbnb housing. With the gradual strengthening of policy management, residential Airbnb listings have been more restricted in the past two years, and professional hosts are more inclined to use business apartments.
The role of professional hosts is growing in Nanjing. Although the number of Nanjing vocational landlords accounted for 32% only, the number of housing that they held increased from 24% in April 2016 to 65% in October 2019. From the perspective of the host’s income ( Fig 5 ), the phenomenon of professionalization and capitalization of Airbnb listings was more significant, with the proportion of professional host income reaching more than 80% at the highest in 2019. In terms of the change in the proportion of the housing income, the initial stage of the market (2016–2017) showed that the proportion of the professional host’s income decreased, but it maintained to rise gradually thereafter. All in all, the proportion of housing income of professional hosts shows the changing trend of a "V" shape, which suggested that the early market development allowed more landlords and entrepreneurs to participate in and make profits from it, reflecting a certain sharing nature. Nevertheless, with the stability of the market, professional hosts occupied most of the short-term rental market and exerted scale effect.
https://doi.org/10.1371/journal.pone.0248647.g005
Meanwhile, more newly developed business apartments have been converted to Airbnb listings, which has become a new way of investing for some professional hosts. In particular, business apartments located in commercial centers, rail transit, and surrounding scenic spots naturally become ideal Airbnb listing choices ( Fig 6 ).
https://doi.org/10.1371/journal.pone.0248647.g006
The above regression results generally confirm that the spatial distribution of Airbnb has been closely related to factors including tourist attractions, the accessibility to urban rail transit, shopping malls, and business apartments. Meanwhile, all these factors are essential reflections of the way in which Nanjing has developed. To better understand the dynamic mechanisms behind the spatial distribution of Airbnb in Nanjing, this section further discusses that how the spatial distribution of Airbnb has been coupled with the urban spatial structure of Nanjing, the rent-gap, and the conversion of business apartments.
The coupling between Airbnb distribution and urban spatial structure
The distance to the city center has an important impact on the distribution of Airbnb listings. 50% of the listings in central Nanjing are concentrated in the old city. The southern part of the old city is the area with the highest listing density in Nanjing, and a cluster center is formed in the south of Xinjiekou. Besides Xinjiekou, the main scenic spots and high-speed railway stations are also the primary attraction for Airbnb in the city. It is shown volatility because of various factors that affect the spatial distribution of Airbnb. In addition, there is a negative correlation between the listing density and the distance from Xinjiekou ( Fig 7 ).
https://doi.org/10.1371/journal.pone.0248647.g007
The analysis shows that cultural attractions, shopping centers, and rail transit have significant positive effects on the agglomeration of Airbnb. The distribution of Airbnb housing resources, centering on the area of Confucius Temple and Xinjiekou, took the subway line as a corridor and formed cluster groups at subway stations, which generally showed the distribution characteristics of “central-corridor”. Airbnb distribution was formed spontaneously from the bottom up, showing a significant self-organization rule, and had a certain coupling relationship with the spatial structure of the city itself ( Fig 8 ), which proved from one side that the urban spatial structure was the sequence of the interaction of various elements of the economy, society, and material environment.
https://doi.org/10.1371/journal.pone.0248647.g008
The correlation between the spatial distribution of Airbnb and rent-gap
The “rent gap” is an important model to interpret the housing market from the perspective of economic drivers [ 21 , 34 , 35 ]. In the research field of Airbnb, researchers such as Wachsmuth and Weisler (2018) [ 4 ] and Yrigoy(2018) [ 8 ] also used the rent gap theory to explain the gentrification risks caused by Airbnb. As Airbnb converts numbers of long rents into short rents, a tendency of increasing commercialization of the landlord is presented, and the rentable housing eventually decreases and rents rise. For the hosts who focus on entrepreneurship, the monthly income of Airbnb listings may be much more than the income of traditional long-term rents, which encourages the hosts to convert the long-term rent into the short-term rent. The rent gap between the long rent and the short rent in Nanjing is shown in Fig 9 . Initially, long-term rents of Nanjing urban residential buildings were in the slow increase. When the short-term rent platform created new potential land rent, the gap between potential rent and the actual rent increased. Fig 9 compares the gap between the median monthly income of active full-house listings in Nanjing (booked for at least one day in the month) and the average rent for long-term rentals. Overall, the rental income of Airbnb listings was significantly higher than that of long-term rentals, with annual revenue exceeding 150% of long-term rentals. It can be seen that Airbnb listings provided additional potential rent, and the rent gap encouraged landlords to use their houses as Airbnb listings. It constantly increased the number of listings, so as to obtain more revenue.
Short-term rent data source: AirDNA, long-term rent data source: China Housing Market.
https://doi.org/10.1371/journal.pone.0248647.g009
As shown in Fig 10 , the spatial distribution of the rent-gap and the distribution of Airbnb are correlated. The high value of long-term rents was concentrated in the city center and sub-center, which was related to the city center system. However, the high value of Airbnb rents was concentrated in the tourist attractions and transport hubs, such as the Confucius Temple area, and Nanjing South Railway Station area, where Airbnb had a high density of distribution. The short-term rents have a stronger economic incentive effect on the conversion of long-term rents, and Airbnb rentals are more likely to continue to grow in this area in the future.
https://doi.org/10.1371/journal.pone.0248647.g010
The conversion of business apartments to Airbnb listings
In general, the excessive development of business apartments in cities further expands the Airbnb listings and becomes an important factor affecting the distribution of Airbnb. In the last decade, the main areas under construction in Nanjing were urban TOD areas and the sub-center area at the periphery of the old city, where a large number of business apartments had been built. Take the CBD of Nanjing South Railway Station as an example. In order to make full use of the land benefits around the high-speed railway station, plenty of commercial and residential mixed land and the commercial complex was planned around the Station. Since 2012, numerous service apartments have been developed and built on these mixed commercial and residential land. These projects had the spatial image of modern cities, reflecting the image of a gateway to the city’s high-speed railway station, and also became new hot spots for real estate investment in Nanjing. A large number of service apartments were used as Airbnb listings, especially the one-bedroom service apartment, which was suitable for operating Airbnb housing. Airbnb increased the possibility of space use and the blending of functions and improved the utilization efficiency of business apartments in the new city to a certain extent. However, this situation also makes Airbnb became more standardized and capitalized, losing the original intention of sharing and communication advocated by Airbnb.
This study aims to solve the following questions: What are the characteristics of the spatial distribution of Airbnb listings in Nanjing city? What factors determine its distribution and expansion? We found that Airbnb listings were not randomly distributed in the city. There were significant and positive correlations between the spatial clustering of Airbnb and the built environments of cities. By comparing the spatial distribution of Airbnb and the spatial structure of central Nanjing, we found that there was a significant coupling between the two. There were a few reasons for it. First, the distribution of Airbnb was related to the distribution of scenic spots, rail transit stations, and shopping malls, while the layout of rail lines itself was related to the urban structure to some extent. Furthermore, the layout of business apartments was also related to the urban structure. Most of them were located in the city center, the new town center, and subway stations. Meanwhile, many of them were inside the large urban commercial complex and were part of the urban public center.
Similar to previous works [ 4 , 5 , 8 ], this study also found that the rent gap between long-term and short-term rent encouraged landlords to convert long-term rental housing sources into short-term rentals. Similarly, professional hosts in Nanjing also played important roles in the Airbnb market, with an increasing proportion of professional hosts, both in terms of quantity and income. Professional landlords had clear entrepreneurial minds. They preferred business apartments around commercial centers and main scenic spots. As the main promoter of Airbnb in Nanjing, professional hosts had important impacts on the spatial distribution and type of Airbnb. This study found that in Nanjing, a rapid-developing Chinese city, a large number of construction of business apartments provided great opportunities for the prosperity of Airbnb, which might be a unique spatial characteristic of Airbnb listings. In the future, there will be more Airbnb hosts choose business apartments as this type of housing, which will enhance the further commercialization and capitalization of Airbnb and boost its turn to boutique hotels.
Airbnb is an emerging urban-space-use mode with the Internet, as well as a model of sharing economy. The findings of this paper may provide positive references for urban renewal policies and public participation methods in China. The key issues are that the government and the industry should pay attention to how to normalize the short-term rental market like Airbnb and how to deal with the new emergence of urban space types under the Internet conditions.
There are many other factors affecting the distribution and development of Airbnb [ 36 – 38 ]. This paper studied the spatial distribution of Airbnb in Nanjing. Thus, the conclusion may be limited to the characteristics of Nanjing’s own development. For the rapidly developing Chinese cities, the conclusion of this paper needs to be further verified and expanded. In addition to further studying the differences in the distribution and types of short-term rentals in different types of Chinese cities, we should pay more attention to the rental shortage and gentrification of communities that Airbnb may cause, especially in the old urban areas of the metropolis in China.
Supporting information
S1 table. data for zero-inflation negative binomial regression..
https://doi.org/10.1371/journal.pone.0248647.s001
- View Article
- Google Scholar
- 17. Barron, K., Kung, E. and Proserpio, D. The Sharing Economy and Housing Affordability: Evidence from Airbnb, EC: Electronic Commerce, 2018, p. 5. Available at: https://search.ebscohost.com/login.aspx?direct=true&db=edb&AN=133089395&lang=zh-cn&site=eds-live (Accessed: 27 August 2020).
- 22. Lane, J.; Woodworth, R.M. Hosts with Multiple Units–A Key Driver of Airbnb Growth; CBRE: Los Angeles, CA, USA, 2017.
- 23. Wachsmuth, D.; Kerrigan, D.; Chaney, D.; Shillolo, A. Short-term cities: Airbnb’s impact on Canadian housing markets. A report from the Urban Politics and Governance research group, School of Urban Planning, McGill University. 2017.
- 24. Wachsmuth, D.; Chaney, D.; Kerrigan, D.; Shillolo, A.; Basalaev-Binder, R. The high cost of short-term rentals in New York City. A report from the Urban Politics and Governance research group, School of Urban Planning, McGill University. 2018.
- 37. Crecente, J. M., Sant_e, I., D_ıaz, C., & Crecente, R. A multi criteria approach to support the location of thalassotherapy (seawater therapy) resorts: Application to Galicia region, NW Spain. Landscape and Urban Planning, 2012, 104(1), 135–147. https://doi.org/10.1016/j.landurbplan.2011.10.010
Airbnb China: Tracking Short-Term Rentals’ Rebound
February 23, 2021
- Search this journal
- Search all journals
- View access options
- View profile
- Create profile
Add email alerts
You are adding the following journal to your email alerts
| New content | |
|---|---|
| Journal of Vacation Marketing |
Examining the Airbnb accommodation experience in Hangzhou through the lens of the Experience Economy Model
Introduction, literature review, research method, implications, limitations, future research, and conclusion, declaration of conflicting interests, cite article, share options, information, rights and permissions, metrics and citations, figures and tables, p2p accommodation development in china, customer experience with lodging industry.
| Author (Year) | Methods | Study context | Theoretical Framework | Key Findings |
|---|---|---|---|---|
| A mixed method approach with qualitative study to conceptualize homescape and questionnaire survey to test the effect of homescape on traveler’s home-like feeling and their well-being. | Airbnb & hotel | Experiencescape construct ( ); Experience economy model ( ); Self-concept and product congruity ( ) | Develop a three-dimension construct of homescape: community, esthetics and home design congruity, and reveal that Airbnb is significantly higher in its facilitation of a home-like experience for healthcare travelers when compared with hotels. | |
| Qualitative study with text-mining approach (a total of 1,026,988 Airbnb guest reviews in the USA) | Airbnb | NA | Extract 15 dimensions on Airbnb guest experience, and among them, 7 are unique dimensions to Airbnb (late check-in, patio and desk view, food in kitchen, help from host, door lock/key, sleep/bed condition, and host response) when compare with hotels from prior studies. | |
| A mixed method approach with qualitative study to conceptualize Airbnb customer experience and questionnaire survey data to explore the relationships between customer experience and behavioral intentions. | Airbnb | Atmospherics theory ( ), theory of self-identity ( ), social sharing of emotions theory ( ) & Self-determination theory ( ) | Conceptualize Airbnb customer experience, which comprises four dimensions: home benefits, personalized services, authenticity and social connection, and reveal that these dimensions significantly influence customers’ behavioral intentions. | |
| Qualitative study with semantics approach (a total of 42,085 review comments in the USA) | Airbnb | NA | Conceptualize home feeling experience on Airbnb, which contains multiple dimensions: physical and spatial, social, and affective, coupled with hospitality. | |
| Qualitative study with text mining and sentiment analysis (a total of 181,263 review comments in Sydney) | Airbnb | NA | Categorize Airbnb experience into location, amenities, and host, and reveal that Airbnb guests tend to evaluate their experience by comparing it to past hotel stays. | |
| Mody et al. (2019b) | Quantitative study with questionnaire survey data | Airbnb & Hotel | Experience economy model ( ) | Develop the concept of ‘experiencescape’ by adding hospitableness to the original four-dimensional structure of the experience economy, and reveal that hospitableness plays a critical role in facilitating favorable experiential and brand-related outcomes. |
| A mixed method approach with texting mining, factor analysis and regression analysis (a total of 33,892 reviews in London) | Airbnb | NA | Extract eight dimensions, namely traffic & accessibility, apartment facilities, interaction & communication, noise & location, home experience, nearby facilities, friendliness of host, and space & comfort contributing to the core experiences of Airbnb. Further, there is a strong association between attributes of sharing experiences and guest satisfaction. | |
| Qualitative study with text mining (a total of 41,560 reviews from Portland, Oregon and the USA) | Airbnb | NA | Customer experience on Airbnb is associated with location (proximity to the point of interest and characteristics of neighborhood), host (service and hospitality) and property (facilities and atmosphere). | |
| A mixed method approach with content analysis and interpretative phenomenological analysis | Network hospitality | Experience economy model ( ) | All dimensions of experience economy were present during network hospitality experience, while educational was most represented. | |
| A mixed method approach with focus group interview and open-ended response-based survey to explore the dimensions of hotel brand experience and questionnaire surveys to validate the scale. | Hotel | The grounded theory | A 17-item five-dimensional hotel brand experience scale is developed with sound psychometric properties: hotel location, hotel stay and ambience, hotel staff competence, hotel website and social media experience, and gest-to-guest experience. | |
| Quantitative study with questionnaire survey data | Airbnb & Hotel | Experience economy model ( ) | Extend Pine and Gilmore’s original experience economy construct by adding four dimensions: serendipity, localness, communitas and personalization, and reveal that Airbnb experiences appear to outperform traditional hotels in all experiential dimensions. | |
| A mixed method approach with in-depth interviews to develop the measurement items of customer experience with budget hotels and questionnaire survey to understand the dimensionality of customer experience and the impact of these dimensions on customer satisfaction. | budget hotel | NA | Four-dimensional construct on customer experience in budget hotel accommodation is developed, namely, tangible and sensorial experience, interactional experience, aesthetic perception, and location, and reveal that these dimensions significantly influence customer satisfaction. | |
| Qualitative method with expert interviews | Restaurant | SERVQUAL ( ) & DIESERV ( ) | Develop a 29-item six dimensional meal experience scale: core product, restaurant interior, personal social meeting, company, restaurant atmosphere and management control system. | |
| A mixed method approach with personal interviews and a subsequent field survey to develop and test a proposed model of experience economy concepts. | Bed & Breakfast | Experience economy model ( ) | Develop a measurement scale tapping four realms of experience that is applicable to lodging. It reveals that four realms of experience offer not only conceptual fit but also a practical measurement framework for the study of tourism experience. |
The Experience Economy Model

The study context
Data collection.
| Aspects | Frequency | Percent |
|---|---|---|
| Type of accommodation | ||
| Entire house | 183 | 72% |
| Private room | 68 | 27% |
| Shared room | 4 | 1% |
| Price of accommodation | ||
| Less than RMB 200 | 79 | 31% |
| RMB 200∼RMB 299 | 93 | 36% |
| RMB 300∼RMB 399 | 53 | 21% |
| RMB 400 and above | 30 | 12% |
| Registration time | ||
| 1 year and less | 11 | 4% |
| 1 year < but ≤2 years | 83 | 33% |
| 2 years < but ≤3 years | 80 | 31% |
| 3 years < but ≤4 years | 62 | 24% |
| More than 4 years | 19 | 8% |
Data analysis
Word frequency analysis.
| Term | TF | Term | TF | |
|---|---|---|---|---|
| 1 | room | 4134 | friends | 465 |
| 2 | host | 3695 | scenic spots | 465 |
| 3 | good | 2844 | eat | 449 |
| 4 | convenience | 2340 | reply | 449 |
| 5 | cleanliness | 2088 | satisfied | 442 |
| 6 | house | 2154 | advice | 441 |
| 7 | cozy | 1995 | excellent | 440 |
| 8 | small | 1828 | subway station | 439 |
| 9 | location | 1810 | livelihood | 439 |
| 10 | stay | 1614 | nice | 414 |
| 11 | like | 1447 | subway | 392 |
| 12 | people | 1449 | arrangement | 376 |
| 13 | check-in | 1360 | picture | 366 |
| 14 | beautiful | 1331 | play | 365 |
| 15 | Hangzhou | 1330 | nearby | 356 |
| 16 | decoration | 1311 | opportunity | 335 |
| 17 | West Lake | 1198 | ready | 331 |
| 18 | hospitality | 1176 | hygiene | 326 |
| 19 | not bad | 982 | pattern | 323 |
| 20 | home-like | 981 | public transportation | 315 |
| 21 | experience | 973 | amenities | 309 |
| 22 | sister | 950 | accommodation | 305 |
| 23 | neighborhood | 945 | loveliness | 305 |
| 24 | warmth | 871 | appreciate | 303 |
| 25 | sweet | 855 | choose | 296 |
| 26 | excellent | 829 | aunt | 285 |
| 27 | environment | 777 | photo | 281 |
| 28 | transportation | 726 | thumb-up | 281 |
| 29 | geography | 722 | walk | 272 |
| 30 | complete | 718 | housing stock | 267 |
| 31 | recommend | 710 | communication | 261 |
| 32 | style | 706 | air conditioning | 251 |
| 33 | super | 700 | kitchen | 247 |
| 34 | home-stay | 690 | design | 242 |
| 35 | feel | 683 | overall | 241 |
| 36 | tidy | 679 | rest room | 239 |
| 37 | downstairs | 653 | far away | 237 |
| 38 | facility | 651 | taxi | 234 |
| 39 | bed | 634 | happy | 222 |
| 40 | watch | 624 | supermarket | 221 |
| 41 | fit | 596 | timely | 220 |
| 42 | near | 594 | project | 217 |
| 43 | nearby | 582 | sleep | 216 |
| 44 | travel | 581 | take photos | 214 |
| 45 | cost effective | 525 | well equipped | 210 |
| 46 | place | 521 | projector | 209 |
| 47 | comfortable | 521 | entrance | 204 |
| 48 | problem | 499 | space | 203 |
| 49 | good-looking | 483 | apartment | 199 |
| 50 | quiet | 472 | details | 197 |
Word cluster analysis
Whole group analysis.

Group comparisons

Customer experience through the lens of the Experience Economy Model
| Domains and Themes | Frequency of Comments |
|---|---|
| Education | Total: 1378 |
| recommend | 710 |
| advice | 441 |
| new/new things | 192 |
| enhance | 20 |
| learned/ knowledgeable | 11 |
| curiosity | 4 |
| Esthetics | Total: 4031 |
| beautiful | 1331 |
| decoration | 1311 |
| environment | 777 |
| design | 242 |
| attention to details | 197 |
| landscape | 173 |
| Entertainment | Total: 1244 |
| watch | 624 |
| take photos | 214 |
| movie | 182 |
| performance | 59 |
| music/CD | 50 |
| captivating | 21 |
| activities | 19 |
| stories | 18 |
| parties | 16 |
| reading | 13 |
| hiking | 10 |
| tea tasting | 7 |
| tour | 6 |
| attend | 5 |
| Escapism | Total: 232 |
| imagine | 87 |
| relaxing | 75 |
| forget daily routine | 53 |
| escaping | 17 |
| Interaction | Total: 4912 |
| host | 3695 |
| reply | 449 |
| cat/dog/pets | 373 |
| communication | 261 |
| chat | 81 |
| friendly | 37 |
| welcoming | 16 |
| Home-feeling | Total: 7078 |
| cozy | 1995 |
| hospitality | 1176 |
| home-like | 981 |
| warmth | 871 |
| sweet | 855 |
| tidy | 679 |
| comfortable | 521 |
| Tangible-sensorial | Total: 13252 |
| room | 4134 |
| cleanliness/hygiene | 2414 |
| house | 2154 |
| small | 1828 |
| bed | 634 |
| quiet | 472 |
| amenities | 309 |
| air-conditioning | 251 |
| kitchen | 247 |
| restroom | 239 |
| well-equipped | 210 |
| projector | 209 |
| smell | 151 |
| Localness | Total: 1119 |
| neighborhood | 945 |
| local | 75 |
| food | 75 |
| culture/customs | 24 |

Entertainment
Interaction, home-feeling, tangible-sensorial, theoretical implications, empirical implications, download to reference manager.
If you have citation software installed, you can download article citation data to the citation manager of your choice
Share this article
Share with email, share on social media, share access to this article.
Sharing links are not relevant where the article is open access and not available if you do not have a subscription.
For more information view the Sage Journals article sharing page.
Information
Published in.

- customer experience
- Experience Economy Model
Rights and permissions
Affiliations, journals metrics.
This article was published in Journal of Vacation Marketing .
Article usage *
Total views and downloads: 2045
* Article usage tracking started in December 2016
Articles citing this one
Receive email alerts when this article is cited
Web of Science: 10 view articles Opens in new tab
Crossref: 0
- Investigating why guests choose to use (or not to use) peer-to-peer ho... Go to citation Crossref Google Scholar
- Examining a Perceived Value Model of Servicescape for Bed-and-Breakfas... Go to citation Crossref Google Scholar
- Sentiment mining of online reviews of peer-to-peer accommodations: Cus... Go to citation Crossref Google Scholar
- Professionalizing Sharing Platforms for Sustainable Growth in the Hosp... Go to citation Crossref Google Scholar
- Exit and transition: Exploring the survival status of Airbnb listings ... Go to citation Crossref Google Scholar
- Eliciting Brand Loyalty with Elements of Customer Experience: A Case S... Go to citation Crossref Google Scholar
- Analysis of airbnb’s green user emotional characteristics: How do huma... Go to citation Crossref Google Scholar
Figures & Media
View options, view options, access options.
If you have access to journal content via a personal subscription, university, library, employer or society, select from the options below:
I am signed in as:
I can access personal subscriptions, purchases, paired institutional access and free tools such as favourite journals, email alerts and saved searches.
Login failed. Please check you entered the correct user name and password.
Access personal subscriptions, purchases, paired institutional or society access and free tools such as email alerts and saved searches.
loading institutional access options
Click the button below for the full-text content
Alternatively, view purchase options below:
Purchase 24 hour online access to view and download content.
Access journal content via a DeepDyve subscription or find out more about this option.
Also from Sage
- CQ Library Elevating debate opens in new tab
- Sage Data Uncovering insight opens in new tab
- Sage Business Cases Shaping futures opens in new tab
- Sage Campus Unleashing potential opens in new tab
- Sage Knowledge Multimedia learning resources opens in new tab
- Sage Research Methods Supercharging research opens in new tab
- Sage Video Streaming knowledge opens in new tab
- Technology from Sage Library digital services opens in new tab

Product details

Teaching and learning

- Share full article
Advertisement
Airbnb shuts down its local business in China.
The home rental service is the last remaining large U.S. internet business in China.

By Erin Griffith
- May 23, 2022
Airbnb, a home rental company, plans to shut down its domestic business in China, in a further sign of the internet decoupling between China and much of the rest of the world.
Airbnb, which has operated in China since 2016, is retreating from the country after struggling to compete with local “superapps” that charge lower fees and less per night on average than in other regions, said a person with knowledge of the situation. The pandemic compounded Airbnb’s business woes, the person said, as China’s “ zero-Covid” policy sent millions into strict lockdown.
Airbnb’s move highlights a growing divide between China’s internet and that of the rest of the world. Many U.S. internet companies have left China after Beijing emphasized domestic businesses, exercised censorship and made other demands of companies. LinkedIn, the only remaining U.S. social network to operate in China, pulled out of the country in October, citing a lack of success with its social media and information features. Airbnb is the last remaining big U.S. internet company in China.
Airbnb, based in San Francisco, will continue to operate a business serving Chinese tourists who were traveling outside of China, the person with knowledge of the situation said. It will keep its Beijing office open with a few hundred employees, the person added.
As part of its retreat, Airbnb will remove roughly 150,000 listings in China, out of six million around the world. Stays in the country have accounted for roughly 1 percent of Airbnb’s business in recent years, the person said.
Airbnb generated $6 billion in revenue last year, up 77 percent from a year earlier. Like many tech companies that went public in recent years, it is under pressure to turn a profit. Airbnb’s stock has fallen 34 percent this year amid a wider rout, even as tourism has surged and the demand for travel services has grown.
CNBC earlier reported on Airbnb’s decision.
Erin Griffith reports on technology start-ups and venture capital from the San Francisco bureau. Before joining The Times she was a senior writer at Wired and Fortune. More about Erin Griffith
- [email protected]
- +86 21 5386 0380

Airbnb officially enters China: Lessons in Market Strategies for Chinese consumers
- July 26, 2016
- Airbnb in China , Home Sharing site in China , Short term accommodation in China , Short-term accommodation booking platforms , tujia in China
To know more about Airbnb in China, contact Daxue Consulting at [email protected]
Airbnb Officially Enters China

In 2015, Airbnb released a statement announcing their desires ‘to clearly understand the needs and desires of Chinese travellers going overseas and partner with Chinese companies to create a truly localised platform’. Airbnb’s approach to the Chinese market is measured and steady. They are not rushing, but intent on obtaining an understanding of their customer before expanding throughout the mainland. Indeed, they have sought local help by raising investment worth $1 500 000 000 from China Broadband and Sequoia Capital. Both have experience in helping foreign internet platforms integrate in China. Airbnb acknowledges that this will help them ‘continue to navigate the China market and create a truly localised presence for the company’. It is no surprise that they have now integrated their app with Chinese social networks, such as Weibo and WeChat. They also now use a localised version of google maps, which is blocked in China, so that their customers can navigate effectively. Their interface is becoming increasingly localised and adapted.
Whilst patient in researching their customer, Airbnb are also taking the time to obtain a positive brand reputation in China. To achieve this, they are targeting China’s outbound tourist market. To date, they have roughly just 1.5% of their listings on the Chinese mainland. Nevertheless, they want to return Chinese travellers to speak highly of their experiences abroad and use Airbnb to replicate their travel memories in China. This appears also as a logical strategy as China’s outbound tourism is increasing. According to China Tourism Research Institute, there were 120 000 000 outbound Chinese tourists in 2015 , an increase of 12% on the previous year. Meanwhile, Daxue Consulting predicts that there will be 200 000 000 Chinese overseas travellers by 2020. If Airbnb access this market successfully their brand reputation across China could soar and allow them to scale rapidly, rather than fighting Tujia as an unknown service. Before scaling in the Chinese mainland, Airbnb is building their brand reputation and researching Chinese consumer behaviour. They are not entering the Chinese mainland explosively. Instead, they are preparing so that it will be easier to scale when they feel sufficiently organised.
By contrast, Uber took to the Chinese market aggressively. It did, however, encounter immediate difficulties. When it officially launched in February of 2014 in Shanghai, Guangzhou and Shenzhen, it quickly had to redesign its software as google map is blocked by the Chinese government. The app was dysfunctional as users could not locate taxis or vice versa. This is a problem Airbnb will not encounter with their more reserved strategy. Moreover, Uber’s expansive approach has not shattered competition. Whilst Uber operates in 50 locations across China, DidiChuxing has amassed 400. Despite being the world’s most valuable start-up, Apple Inc. chose to invest $1 000 000 000 inDidiChuxing. This is symbolic of Uber’s struggles in China. They have not eradicated competition and have had trouble adapting their services to the demands of Chinese society. They are even using their profits from other regions in the world to support their efforts in China. Indeed, the calendar year of 2015 witnessed Uber loses $1 000 000 000. Nevertheless, it should be mentioned that this does not demonstrate that Uber has failed. Their push into the Chinese market might end up profitable. Only time will tell.
In summation, many foreign companies face competition from their Chinese equivalents upon entry into China’s markets. They do not, however, adopt identical market strategies. One can see that Airbnb has been patient before scaling in the Chinese market. They want to understand their customer sufficiently and build their brand reputation. The expansion, therefore, could be demand led. Contrastingly, Uber have pursued a supply led strategy as they entered the market aggressively. Whilst they have struggled to generate profit, it is unclear whether this will continue. It is equally uncertain whether Airbnb’s strategy will prove effective. Their differing strategies are worth following though as it could provide insights into the effective means to successfully enter China’s markets.
Case Study: Usability Testing in China
A multinational company for household goods wanted to test its App features for China and explore how Chinese consumers respond to the App’s first version. After a long development time, the client had built the first version for the European market. The client contacted Daxue to conduct some exploratory research with the user testing methodology in China . The client received real feedback from potential users of the App on how well the App served the customers’ needs and preferences.
The client obtained rich and qualitative insights about their target demographic, as well as the right tools to turn their App users into store customers.
- Airbnb in China and its competition
- Daxue’s latest Twitter post:
Tujia Beats Airbnb with Tailor-Made Services. More at https://t.co/mCzcjqymgf #marketresearch #hotel #China pic.twitter.com/lKnLlZR1cy — Daxue Consulting (@DaxueConsulting) July 22, 2016
Image source from https://goingawesomeplaces.com/

New market insights
Beyond basics: china’s haircare market shifts toward skincare-inspired haircare, meal kits in china: catering to modern lifestyles with convenience and culinary variety, hong kong’s insurance market explores new paths of growth, cosmetics market in china: how consumer preferences are evolving and what trends are emerging, how china’s footwear industry is coping with shifting consumer preferences, china’s skincare market: from ingredient-savvy “skintellectuals” to moms and teens, contact info.
- +86 21 5386 03805
- Business inquiry: [email protected]
- Press inquiry: [email protected]
- Daxue Consulting Beijing, Dongzhong Jie #40, Beijing, China 北京东城区东中街40号元嘉国际A座726室
- Daxue Consulting Shanghai, 272 Ruijin Er Road, Building 2, Office 501, Huangpu District, Shanghai, China 上海市黄浦区瑞金二路272号2号楼501房间
- Daxue Consulting Hong Kong, 33 Hillier St, Sheung Wan, Hong-Kong 香港上环 33-35禧利街
Get the latest China market insights
The monthly report will allow you to keep track of the most important upcoming events about China around the world, as well as not to miss useful articles and reports. While the weekly newspaper will talk about the daily business cases of China, important local events and news.
- Consultants
Market insights
- Market reports
- Business podcasts
Daxue group
- Daxens - sensory research
- Doxaganda - branding in China
- DaxLr - growth acceleration
- Sinonym - chinese brand naming
- China business podcast
Information
- Author Services
Initiatives
You are accessing a machine-readable page. In order to be human-readable, please install an RSS reader.
All articles published by MDPI are made immediately available worldwide under an open access license. No special permission is required to reuse all or part of the article published by MDPI, including figures and tables. For articles published under an open access Creative Common CC BY license, any part of the article may be reused without permission provided that the original article is clearly cited. For more information, please refer to https://www.mdpi.com/openaccess .
Feature papers represent the most advanced research with significant potential for high impact in the field. A Feature Paper should be a substantial original Article that involves several techniques or approaches, provides an outlook for future research directions and describes possible research applications.
Feature papers are submitted upon individual invitation or recommendation by the scientific editors and must receive positive feedback from the reviewers.
Editor’s Choice articles are based on recommendations by the scientific editors of MDPI journals from around the world. Editors select a small number of articles recently published in the journal that they believe will be particularly interesting to readers, or important in the respective research area. The aim is to provide a snapshot of some of the most exciting work published in the various research areas of the journal.
Original Submission Date Received: .
- Active Journals
- Find a Journal
- Proceedings Series
- For Authors
- For Reviewers
- For Editors
- For Librarians
- For Publishers
- For Societies
- For Conference Organizers
- Open Access Policy
- Institutional Open Access Program
- Special Issues Guidelines
- Editorial Process
- Research and Publication Ethics
- Article Processing Charges
- Testimonials
- Preprints.org
- SciProfiles
- Encyclopedia
Article Menu
- Subscribe SciFeed
- Recommended Articles
- Google Scholar
- on Google Scholar
- Table of Contents
Find support for a specific problem in the support section of our website.
Please let us know what you think of our products and services.
Visit our dedicated information section to learn more about MDPI.
JSmol Viewer
A study on airbnb’s trust mechanism and the effects of cultural values—based on a survey of chinese consumers.

1. Introduction
2. literature review, 2.1. the sharing economy and airbnb, 2.2. trust in e-commerce and trust in the sharing economy, 2.3. cultural values and trust, 3. research model and hypotheses, 3.1. research model, 3.2. hypotheses, 3.2.1. institutional trust (it), 3.2.2. interpersonal trust (ipt), 3.2.3. product trust (pt), 3.2.4. cultural values, 4. research methodology, 4.1. survey administration, 4.2. the descriptive statistical analyses of the respondents, 4.3. the descriptive statistical analyses of the constructs, 5.1. validity analysis and reliability analysis, 5.2. testing the research hypotheses, 5.2.1. test of the trust mechanism model, 5.2.2. test of the hypotheses that take cultural value factors and demographics as moderators, 6. discussions, 7. contributions, 8. conclusions, author contributions, conflicts of interest.
- Your nationality: ________________________________
- Your gender: □Male □Female
- Your age: □≤25 □26–35 □36–45 □≥45
- Your education background: □Junior college and below □Undergraduate □Master □Doctor
- Your disposable income per month: □≤ $ 150 □ $ 150–500 □ $ 500–850 □≥ $ 850
| No. | Description | Strongly Agree | Agree | Neutral | Disagree | Strongly Disagree |
| PDI1 | The social class differences caused by power and wealth is normal | 5 | 4 | 3 | 2 | 1 |
| PDI2 | We should reduce or eliminate the gap between power and status | 5 | 4 | 3 | 2 | 1 |
| UAI1 | You are more accustomed to a regular pattern of work rather than a new change | 5 | 4 | 3 | 2 | 1 |
| UAI2 | You can easily feel anxious or frightened in a strange environment | 5 | 4 | 3 | 2 | 1 |
| IDV1 | We should concern ourselves with collective interests rather than personal interests. | 5 | 4 | 3 | 2 | 1 |
| IDV2 | Everyone is totally independent and different from other people | 5 | 4 | 3 | 2 | 1 |
| MAS1 | Men always do better than women in some jobs. | 5 | 4 | 3 | 2 | 1 |
| MAS2 | We should devote ourselves to building a harmonious social relationship. | 5 | 4 | 3 | 2 | 1 |
| LTO1 | There should be a long-term plan for everything. | 5 | 4 | 3 | 2 | 1 |
| LTO2 | You care more about the future than your immediate interests. | 5 | 4 | 3 | 2 | 1 |
| No. | Description | Strongly Agree | Agree | Neutral | Disagree | Strongly Disagree |
| IT1 | I think Airbnb has a good reputation | 5 | 4 | 3 | 2 | 1 |
| IT2 | I would browse the description of the house and the previous reviews | 5 | 4 | 3 | 2 | 1 |
| IT3 | I am not sensitive to the risks in accommodation transaction | 5 | 4 | 3 | 2 | 1 |
| IT4 | I will not take the initiative in referring to the terms and policies of Airbnb | 5 | 4 | 3 | 2 | 1 |
| IPT1 | During the stay, the host should fulfill his service commitments | 5 | 4 | 3 | 2 | 1 |
| IPT2 | The host and renter should not reveal their mutual privacy | 5 | 4 | 3 | 2 | 1 |
| IPT3 | The host is gracious and polite, which makes me happy. | 5 | 4 | 3 | 2 | 1 |
| IPT4 | The host should answer my question in time | 5 | 4 | 3 | 2 | 1 |
| IPT5 | The host’s active care will make me happy. | 5 | 4 | 3 | 2 | 1 |
| IPT6 | I like to interact with my host and even become friends. | 5 | 4 | 3 | 2 | 1 |
| PT1 | I care about the decor of the room | 5 | 4 | 3 | 2 | 1 |
| PT2 | I care about the comfort of the room | 5 | 4 | 3 | 2 | 1 |
| PT3 | I care if the facilities in the room are complete. | 5 | 4 | 3 | 2 | 1 |
| PT4 | I care about the sanitation in the room | 5 | 4 | 3 | 2 | 1 |
| PT5 | I care about the soundproof effect of the room | 5 | 4 | 3 | 2 | 1 |
| PT6 | I care about the traffic conditions around the house | 5 | 4 | 3 | 2 | 1 |
| PT7 | I would choose a house with good public security | 5 | 4 | 3 | 2 | 1 |
| PT8 | I will choose a house that is prosperous and bustling around me. | 5 | 4 | 3 | 2 | 1 |
| PT9 | I will choose a house that has many tourism attractions around me. | 5 | 4 | 3 | 2 | 1 |
- Belk, R. Sharing. J. Consum. Res. 2009 , 36 , 715–734. [ Google Scholar ] [ CrossRef ]
- Kang, S.; Na, Y.K. The Effect of the Relationship Characteristics and Social Capital of the Sharing Economy Business on the Social Network, Relationship Competitive Advantage, and Continuance Commitment. Sustainability 2018 , 10 , 1–22. [ Google Scholar ] [ CrossRef ]
- Rifkin, J. The Zero Marginal Cost Society: The Internet of Things, the Collaborative Commons, and the Eclipse of Capitalism ; St. Martin’s Press: New York, NY, USA, 2014. [ Google Scholar ]
- Heinrichs, H. Sharing economy: A potential new pathway to sustainability. GAIA-Ecol. Perspect. Sci. Soc. 2013 , 22 , 228–231. [ Google Scholar ] [ CrossRef ]
- Botsman, R.; Rogers, R. What’s Mine Is Yours: The Rise of Collaborative Consumption ; Harper Collins e-books: New York, NY, USA, 2010. [ Google Scholar ]
- Hamari, J.; Sjöklint, M.; Ukkonen, A. The sharing economy: Why people participate in collaborative consumption. J. Assoc. Inf. Sci. Technol. 2016 , 67 , 2047–2059. [ Google Scholar ] [ CrossRef ]
- Schor, J.B.; Fitzmaurice, C.J. 26. Collaborating and connecting: The emergence of the sharing economy. In Handbook of Research on Sustainable Consumption ; Edward Elgar Publishing: Cheltenham, UK, 2015; p. 410. [ Google Scholar ]
- Martin, E.W.; Shaheen, S.A. Greenhouse Gas Impacts of Car Sharing in North America. In Mineta Transportation Institute Report 09-11 ; Mineta Transportation Institute: San Jose, CA, USA, 2010. [ Google Scholar ]
- Sundararajan, A. From Zipcar to the sharing economy. Harv. Bus. Rev. 2013 . Available online: https://hbr.org/2013/01/from-zipcar-to-the-sharing-eco (accessed on 20 August 2018).
- Zervas, G.; Proserpio, D.; Byers, J.W. The rise of the sharing economy: Estimating the impact of Airbnb on the hotel industry. J. Mark. Res. 2017 , 54 , 687–705. [ Google Scholar ] [ CrossRef ]
- Brescia, R.H. Regulating the Sharing Economy: New and Old Insights into an Oversight Regime for the Peer-to-Peer Economy. Neb. Law Rev. 2016 , 95 , 1–69. [ Google Scholar ]
- Koopman, C.; Mitchell, M.; Thierer, A. The Sharing Economy and Consumer Protection Regulation: The Case for Policy Change. J. Bus. Entrep. Law 2015 , 8 , 529. [ Google Scholar ] [ CrossRef ]
- Cohen, M.; Sundararajan, A. Self-Regulation and Innovation in the Peer-to-Peer Sharing Economy. Univ. Chic. Law Rev. Online 2015 , 82 , 116. [ Google Scholar ]
- Nuñez-Cacho, P.; Górecki, J.; Molina-Moreno, V.; Corpas-Iglesias, F.A. What is measured is done: Development of a circular scale measuring the economy for the construction industry. Sustainability 2018 , 10 , 2340. [ Google Scholar ] [ CrossRef ]
- Wu, J.; Ma, P.; Xie, K.L. In sharing economy we trust: The effects of host attributes on short-term rental purchases. Int. J. Contemp. Hosp. Manag. 2017 , 29 , 2962–2976. [ Google Scholar ] [ CrossRef ]
- Schor, J.B. Plenitude: The New Economics of True Wealth ; Penguin Press: New York, NY, USA, 2010. [ Google Scholar ]
- Gansky, L. The Mesh: Why the Future of Business Is Sharing ; Penguin: New York, NY, USA, 2010. [ Google Scholar ]
- Cheng, M. Sharing economy: A review and agenda for future research. Int. J. Hosp. Manag. 2016 , 57 , 60–70. [ Google Scholar ] [ CrossRef ]
- PricewaterhouseCoopers. Customer Intelligence Series: The Sharing Economy, 18 April 2015. Available online: http://www.pwc.com/us/en/industry/entertainment-media/publications/consumer-intelligence-series/assets/pwc-cis-sharing-economy.pdf (accessed on 5 April 2017).
- Lee, C. Airbnb Sees China as Its Number One Market by 2020. Available online: https://www.zdnet.com/article/airbnb-sees-china-as-its-number-one-market-by-2020,2017-12-10/2018-07-31 (accessed on 1 August 2018).
- Liu, Y.; Yang, Y. Empirical Examination of Users’ Adoption of the Sharing Economy in China Using an Expanded Technology Acceptance Model. Sustainability 2018 , 10 , 1262. [ Google Scholar ] [ CrossRef ]
- General Office of the State Council. Guidance on Promoting Holistic Tourism Destinations Development. Available online: http://www.gov.cn/gongbao/content/2018/content_5280575.htm (accessed on 1 August 2018).
- Retail & Ecommerce. Airbnb’s Troubles in Spain Grow Alongside Greater Use. Available online: https://www.emarketer.com/Article/Airbnbs-Troubles-Spain-Grow-Alongside-Greater-Use/1015323,2017-02-28 (accessed on 1 August 2018).
- PConline. The Local Government in Detroit has Quietly Imposed a Ban on Airbnb Rentals. Available online: http://pcedu.pconline.com.cn/1083/10835553.html,2018-02-12 (accessed on 1 August 2018).
- Fukuyama, F. Trust: The Social Virtues and the Creation of Prosperity ; Free Press Paperbacks: New York, NY, USA, 1995. [ Google Scholar ]
- Doney, P.M.; Cannon, J.P.; Mullen, M.R. Understanding the influence of national culture on the development of trust. Acad. Manag. Rev. 1998 , 23 , 601–620. [ Google Scholar ] [ CrossRef ]
- Bjørnskov, C. Determinants of generalized trust: A cross-country comparison. Public Choice 2007 , 130 , 1–21. [ Google Scholar ] [ CrossRef ]
- Cyr, D. Website design, trust and culture: An eight country investigation. Electron. Commer. Res. Appl. 2013 , 12 , 373–385. [ Google Scholar ] [ CrossRef ] [ Green Version ]
- Ert, E.; Fleischer, A.; Magen, N. Trust and reputation in the sharing economy: The role of personal photos in Airbnb. Tour. Manag. 2016 , 55 , 62–73. [ Google Scholar ] [ CrossRef ]
- Ufford, S. The Future of the Sharing Economy Depends on Trust. Forbes, 2015. Available online: http://www.forbes.com/sites/theyec/2015/02/10/the-future-of-the-sharing-economydepends-on-trust (accessed on 9 October 2017).
- Finley, K. Trust in the Sharing Economy: An Exploratory Study ; Centre for Cultural Policy Studies; University of Warwick: Coventry, UK, 2013. [ Google Scholar ]
- Zucker, L.G. Production of trust: Institutional sources of economic structure, 1840–1920. Res. Organ. Behav. 1986 , 8 , 53–111. [ Google Scholar ]
- Palos-Sanchez, P.R.; Correia, M.B. The Collaborative Economy Based Analysis of Demand: Study of Airbnb Case in Spain and Portugal. J. Theor. Appl. Electron. Commer. Res. 2018 , 13 , 85–98. [ Google Scholar ] [ CrossRef ]
- Bardhi, F.; Eckhardt, G.M. Access-based consumption: The case of car sharing. J. Consum. Res. 2012 , 39 , 881–898. [ Google Scholar ] [ CrossRef ]
- Ritzer, G.; Jurgenson, N. Production, consumption, prosumption: The nature of capitalism in the age of the digital ‘prosumer’. J. Consum. Cult. 2010 , 10 , 13–36. [ Google Scholar ] [ CrossRef ]
- Tussyadiah, I.P. Factors of satisfaction and intention to use peer-to-peer accommodation. Int. J. Hosp. Manag. 2016 , 55 , 70–80. [ Google Scholar ] [ CrossRef ]
- Sigala, M. Collaborative commerce in tourism: Implications for research and industry. Curr. Issues Tour. 2017 , 20 , 346–355. [ Google Scholar ] [ CrossRef ]
- Piscicelli, L.; Cooper, T.; Fisher, T. The role of values in collaborative consumption: Insights from a product-service system for lending and borrowing in the UK. J. Clean. Prod. 2015 , 97 , 21–29. [ Google Scholar ] [ CrossRef ]
- Stors, N.; Kagermeier, A. Motives for Using Airbnb in Metropolitan Tourism—Why do People Sleep in the Bed of a Stranger? Reg. Mag. 2015 , 299 , 17–19. [ Google Scholar ] [ CrossRef ]
- Rogers, K. Hosts Generated $ 500 Million a Year on Airbnb: Study. Consumer News and Business Channel. 2016. Available online: http://www.cnbc.com/2016/01/20/hosts-generated-500-million-a-year-on-airbnb-study.html (accessed on 23 July 2017).
- Glaeser, E.L.; Laibson, D.I.; Scheinkman, J.A.; Soutter, C.L. Measuring trust. Q. J. Econ. 2000 , 115 , 811–846. [ Google Scholar ] [ CrossRef ]
- McKnight, D.H.; Chervany, N.L.; Cummings, L.L. Trust formation in new organizational relationships. In Management Information Systems Research Center ; Curtis, L., Ed.; Carlson School of Management, University of Minnesota: Minneapolis, MN, USA, 1996. [ Google Scholar ]
- Lewicki, R.J.; Tomlinson, E.C.; Gillespie, N. Models of interpersonal trust development: Theoretical approaches, empirical evidence, and future directions. J. Manag. 2006 , 32 , 991–1022. [ Google Scholar ] [ CrossRef ]
- McKnight, D.H.; Chervany, N.L. What trust means in e-commerce customer relationships: An interdisciplinary conceptual typology. Int. J. Electron. Commer. 2001 , 6 , 35–59. [ Google Scholar ] [ CrossRef ]
- Morgan, R.M.; Hunt, S.D. The commitment-trust theory of relationship marketing. J. Mark. 1994 , 58 , 20–38. [ Google Scholar ] [ CrossRef ]
- Kumar, N. The power of trust in manufacturer-retailer relationships. Harv. Bus. Rev. 1996 , 74 , 92. [ Google Scholar ]
- Gefen, D. E-commerce: The role of familiarity and trust. Omega 2000 , 28 , 725–737. [ Google Scholar ] [ CrossRef ]
- Schoorman, F.D.; Mayer, R.C.; Davis, J.H. An integrative model of organizational trust: Past, present, and future. Acad. Manag. Rev. 2007 , 32 , 344–354. [ Google Scholar ] [ CrossRef ]
- Pavlou, P.A.; Gefen, D. Building effective online marketplaces with institution-based trust. Inf. Syst. Res. 2004 , 15 , 37–59. [ Google Scholar ] [ CrossRef ]
- Kim, D.J.; Ferrin, D.L.; Rao, H.R. A trust-based consumer decision-making model in electronic commerce: The role of trust, perceived risk, and their antecedents. Decis. Support Syst. 2008 , 44 , 544–564. [ Google Scholar ] [ CrossRef ]
- Weber, T.A. Intermediation in a sharing economy: Insurance, moral hazard, and rent extraction. J. Manag. Inf. Syst. 2014 , 31 , 35–71. [ Google Scholar ] [ CrossRef ]
- Hawlitschek, F.; Teubner, T.; Adam, M.T.P.; Borchers, N.S.; Möhlmann, M.; Weinhardt, C. Trust in the sharing economy: An experimental framework. In Proceedings of the Thirty Seventh International Conference on Information Systems (ICIS 2016), Dublin, Ireland, 11–14 December 2016. [ Google Scholar ]
- Joinson, A.N.; Reips, U.D.; Buchanan, T.; Schofield, C.P. Privacy, trust, and self-disclosure online. Human–Comput. Interact. 2010 , 25 , 1–24. [ Google Scholar ] [ CrossRef ]
- Mittendorf, C. What Trust means in the Sharing Economy: A provider perspective on Airbnb.com. In Proceedings of the AMCIS 2016, San Diego, CA, USA, 11–14 August 2016. [ Google Scholar ]
- Yoon, H.S.; Occeña, L.G. Influencing factors of trust in consumer-to-consumer electronic commerce with gender and age. Int. J. Inf. Manag. 2015 , 35 , 352–363. [ Google Scholar ] [ CrossRef ]
- Gefen, D.; Benbasat, I.; Pavlou, P. A research agenda for trust in online environments. J. Manag. Inf. Syst. 2008 , 24 , 275–286. [ Google Scholar ] [ CrossRef ]
- Kamal, P.; Chen, J.Q. Trust in Sharing Economy. In Proceedings of the PACIS 2016, Chiayi, Taiwan, 27 June–1 July 2016; p. 109. [ Google Scholar ]
- Xie, X.M.; Shi, J.J. Empiricla Research on formation mechanism of consumer trust in sharing economy. Technol. Econ. 2016 , 35 , 122–127. [ Google Scholar ]
- Núñez-Cacho, P.; Molina-Moreno, V.; Corpas-Iglesias, F.A.; Cortés-García, F.J. Family Businesses in Transition to a Circular Economy Model: The Case of “Mercadona”. Sustainability 2018 , 10 , 538. [ Google Scholar ] [ CrossRef ]
- Hofstede, G. Culture’s Consequences: International Differences in Work-Related Values ; Sage: Newcastle upon Tyne, UK, 1984. [ Google Scholar ]
- Kluckhohn, F.R.; Strodtbeck, F.L. Variations in Value Orientations ; Greenwood Press: London, UK, 1961. [ Google Scholar ]
- Schwartz, S.H.; Verkasalo, M.; Antonovsky, A.; Sagiv, L. Value priorities and social desirability: Much substance, some style. Br. J. Soc. Psychol. 1997 , 36 , 3–18. [ Google Scholar ] [ CrossRef ]
- Luthans, F.; Doh, J.P. Cross-cultural Communication and Management , 9th ed.; McGraw-Hill: New York, NY, USA, 2008. [ Google Scholar ]
- Yamagishi, T. The provision of a sanctioning system in the United States and Japan. Soc. Psychol. Q. 1988 , 51 , 265–271. [ Google Scholar ] [ CrossRef ]
- Hallikainen, H.; Laukkanen, T. National culture and consumer trust in e-commerce. Int. J. Inf. Manag. 2018 , 38 , 97–106. [ Google Scholar ] [ CrossRef ]
- Suh, T.; Kwon, I.W.G. Globalization and reluctant buyers. Int. Mark. Rev. 2002 , 19 , 663–680. [ Google Scholar ] [ CrossRef ]
- Yoon, C. The effects of national culture values on consumer acceptance of e-commerce: Online shoppers in China. Inf. Manag. 2009 , 46 , 294–301. [ Google Scholar ] [ CrossRef ]
- Jarvenpaa, S.L.; Leidner, D.E. Communication and trust in global virtual teams. Organ. Sci. 1999 , 10 , 791–815. [ Google Scholar ] [ CrossRef ]
- Gefen, D.; Heart, T.H. On the need to include national culture as a central issue in e-commerce trust beliefs. J. Glob. Inf. Manag. 2006 , 14 , 1–30. [ Google Scholar ] [ CrossRef ]
- Triandis, H.C. The self and social behavior in differing cultural contexts. Psychol. Rev. 1989 , 96 , 506. [ Google Scholar ] [ CrossRef ]
- Srite, M.; Karahanna, E. The role of espoused national cultural values in technology acceptance. MIS Q. 2006 , 30 , 679–704. [ Google Scholar ] [ CrossRef ]
- Parasuraman, A.; Zeithaml, V.A.; Berry, L.L. SERVQUAL: A Multiple-Item Scale for Measuring Consumer Perceptions of Service Quality. J. Retail. 1998 , 1 , 12–40. [ Google Scholar ]
- Parasuraman, A.; Zeithaml, V.A.; Malhotra, A. E-S-QUAL: A Multiple-Item Scale for Accessing Electronic Service Quality. J. Serv. Res. 2005 , 7 , 213–233. [ Google Scholar ] [ CrossRef ]
- Pavlou, P.A.; Dimoka, A. The Nature and Role of Feedback Text Comments in Online Marketplaces: Implications for Trust Building, Price Premiums, and Seller Differentiation. Inf. Syst. Res. 2006 , 17 , 392–414. [ Google Scholar ] [ CrossRef ]
- Zhang, X.; Yang, Y. An Evaluation on Service Quality of B&B. Industry in China. J. Huzhou Univ. 2017 , 39 , 59–66. [ Google Scholar ]
- Li, D.; Qiu, F.; Dong, C. Empirical Study on Evaluation System of Bed and Breakfast Resources. World Sci.-Tech. R D 2015 , 37 , 404–409. [ Google Scholar ]
- Jones, D.; Guan, J.J. Bed and Breakfast Lodging Development in Mainland China: Who is the Potential Customer. Asia Pac. J. Tour. Res. 2011 , 16 , 517–536. [ Google Scholar ] [ CrossRef ]
- Gimasekaran, N.; Anandkumar, V. Factors of Influence in Choosing Alternative Accommodation: A Study with Reference to Pondicherry, A Coastal Heritage Town. Procedia-Soc. Behav. Sci. 2012 , 62 , 1127–1132. [ Google Scholar ] [ CrossRef ]
- Yang, S.; Ahn, S. Impact of motivation in the sharing economy and perceived security in attitude and loyalty toward Airbnb. Adv. Sci. Technol. Lett. 2016 , 129 , 180–184. [ Google Scholar ]
- Wu, M. Structural Equation Model—AMOS Operation and Application ; Chongqing University Press: Chongqing, China, 2010. (In Chinese) [ Google Scholar ]
- China Tourism Academy, Airbnb China. 2017 Report on The Trend of Sharing Lodging Consumption in China. Available online: http://www.china.com.cn/travel/txt/2017-06/09/content_40995677.htm (accessed on 12 September 2017).
- Hofstede, G. Culture’s Consequences: Comparing Values, Behaviors, Institutions and Organizations Across Nations ; Sage Publications: Newcastle upon Tyne, UK, 2003. [ Google Scholar ]
- Leidner, D.E.; Kayworth, T. A review of culture in information systems research: Toward a theory of information technology culture conflict. MIS Q. 2006 , 30 , 357–399. [ Google Scholar ] [ CrossRef ]
Click here to enlarge figure
| Constructs | Categories | References |
|---|---|---|
| Institutional trust | The reputation and quality of the website | [ , , , ]; |
| Description of the listing | ||
| Risk perception of the website | ||
| Structural assurance of the website | ||
| Interpersonal trust | The hosts’ ability to fulfill service commitment | [ , , , ]; |
| The host-guest principle of not leaking mutual privacy | ||
| The host’s courteous manners | ||
| The timeliness of the host’s response to problems | ||
| The host’s ability of initiative care for renters | ||
| The realization of social values of host and guest | ||
| Product trust | Decoration styles | [ , , , , ]; |
| Comfort level of rooms | ||
| Well-equipped facilities in rooms | ||
| Daily cleaning | ||
| Sound insulation effect of rooms | ||
| Travel convenience | ||
| Neighborhood environment | ||
| Surrounding tourist attractions | ||
| Cultural dimensions | Power distance | [ , ]; |
| Individualism | ||
| Masculinity | ||
| Uncertainty avoidance | ||
| Long-term orientation |
| No. | Hypotheses |
|---|---|
| H1 | Institutional trust has a positive and significant impact on product trust. |
| H1a | The relationships between institutional trust and product trust are adjusted by power distance. The higher the power distance is, the weaker the influence of institutional trust on product trust will be. |
| H1b | The relationships between institutional trust and product trust are adjusted by individualism. The higher the individualism is, the weaker the influence of institutional trust on product trust will be. |
| H1c | The relationships between institutional trust and product trust are adjusted by uncertainty avoidance. The higher the uncertainty avoidance is, the weaker the influence of institutional trust on product trust will be. |
| H1d | The relationships between institutional trust and product trust are adjusted by long-term orientation. The higher the long-term orientation is, the stronger the influence of institutional trust on product trust will be. |
| H1e | The relationships between institutional trust and product trust are adjusted by masculinity. The higher the masculinity is, the weaker the influence of institutional trust on product trust will be. |
| H2 | Product trust has a positive and significant impact on interpersonal trust. |
| H2a | The relationships between product trust and interpersonal trust are adjusted by power distance. The higher power distance is, the weaker the influence between product trust and interpersonal trust will be. |
| H2b | The relationships between product trust and interpersonal trust are adjusted by individualism. The higher individualism is, the weaker the influence between product trust and interpersonal trust will be. |
| H2c | The relationships between product trust and interpersonal trust are adjusted by uncertainty avoidance. The higher uncertainty avoidance is, the weaker the influence between product trust and interpersonal trust will be. |
| H2d | The relationships between product trust and interpersonal trust are adjusted by long-term orientation. The higher long-term orientation is, the stronger the influence between product trust and interpersonal trust will be. |
| H2e | The relationships between product trust and interpersonal trust are adjusted by masculinity. The higher masculinity is, the weaker the influence between product trust and interpersonal trust will be. |
| H3 | Institutional trust has a positive and significant impact on interpersonal trust. |
| H3a | The relationships between institutional trust and interpersonal trust are adjusted by power distance. The higher the power distance is, the weaker the influence of institutional trust on interpersonal trust will be. |
| H3b | The relationships between institutional trust and interpersonal trust are adjusted by individualism. The higher the individualism is, the weaker the influence of institutional trust on interpersonal trust will be. |
| H3c | The relationships between institutional trust and interpersonal trust are adjusted by uncertainty avoidance. The higher the uncertainty avoidance is, the weaker the influence of institutional trust on interpersonal trust will be. |
| H3d | The relationships between institutional trust and interpersonal trust are adjusted by long-term orientation. The higher the long-term orientation is, the stronger the influence of institutional trust on interpersonal trust will be. |
| H3e | The relationships between institutional trust and interpersonal trust are adjusted by masculinity. The higher the masculinity is, the weaker the influence of institutional trust on interpersonal trust will be. |
| H4 | The relationships between institutional trust and product trust are significantly different regarding the demographics of consumers interviewed. |
| H5 | The relationships between product trust and interpersonal trust are significantly different regarding the demographics of consumers interviewed. |
| H6 | The relationships between institutional trust and interpersonal trust are significantly different regarding the demographics of consumers interviewed. |
| Variables | Categories | Frequency | Percentage |
|---|---|---|---|
| Gender | Men | 63 | 30.00% |
| Women | 147 | 70.00% | |
| Age | ≤25 | 140 | 66.67% |
| 26–35 | 51 | 24.29% | |
| 36-45 | 17 | 8.09% | |
| ≥45 | 2 | 0.95% | |
| Education | College degree or below | 10 | 4.76% |
| Bachelor candidates and bachelor | 132 | 62.86% | |
| Master | 65 | 30.95% | |
| Doctor | 3 | 1.43% | |
| Monthly disposable income (yuan) | ≤1000 | 21 | 10.00% |
| 1001–3000 | 91 | 43.33% | |
| 3001–5000 | 58 | 27.62% | |
| ≥5000 | 40 | 19.05% |
| Construct | Mean (Std.) | Hofstede Score (China) |
|---|---|---|
| Power distance | 3.09 (0.605) | 80 |
| Uncertainty avoidance | 2.907 (0.851) | 60 |
| Individualism | 3.383 (0.665) | 21 |
| Masculinity | 2.567 (0.658) | 51 |
| Long-term orientation | 3.602 (0.844) | 118 |
| Construct | Mean (Std.) of the Construct |
|---|---|
| Institutional trust | 3.43 (0.538) |
| Interpersonal trust | 3.67 (0.535) |
| Product trust | 4.02 (0.762) |
| Assessment Items | Recommended Value | Testing Results |
|---|---|---|
| KMO value | >0.6 | 0.944 |
| Bartlett’s test | Significance level <0.05 | 0 |
| Common factor variance ratio | >0.2 | 0.428–0.821 |
| Accumulated variance contribution rate | >60% | 67.258% (3 common factors in all) |
| Cronbach α coefficient | >0.7 | 0.89 |
| Indexes of fitness degree | ||
| Chi-square = 361.249; degrees of freedom (DOF) = 146; probability level = 0.000 | ||
| Chi-square DOF ratio | <3.00 | 2.474 |
| RMR (root mean square residual) value | <0.05 | 0.048 |
| GFI (goodness-of-fit index) value | >0.90 | 0.837 |
| IFI (incremental fit index) value | >0.90 | 0.927 |
| TLI (Tacker-Lewis index) value | >0.90 | 0.913 |
| CFI (comparative fit index) value | >0.90 | 0.926 |
| PGFI (parsimony goodness-of-fit index) value | >0.50 | 0.643 |
| PNFI (parsimony-adjusted normed fit index) value | >0.50 | 0.754 |
| PCFI (parsimony comparative fit index) value | >0.50 | 0.791 |
| CN (critical N) value | >200 | 102 |
| CAIC (consistent Akaike information criterion) value | Theoretical model value < independent model value | 640.522 < 1205.950 |
| Theoretical model value < saturation model | 640.522 < 3196.94 | |
| No. | Hypotheses | C.R. (Critical Ratio) | Path Coefficient | R | p | Is the Research Hypotheses Supported? |
|---|---|---|---|---|---|---|
| H1 | Institutional trust has a positive and significant impact on product trust. | 6.766 | 0.822 | 0.676 | *** | Yes |
| H2 | Product trust has a positive and significant impact on interpersonal trust. | 7.106 | 0.762 | 0.892 | *** | Yes |
| H3 | Institutional trust has a positive and significant impact on interpersonal trust. | 2.14 | 0.213 | 0.892 | 0.032 | Yes |
| Model | DF (Degree of Freedom) | CMIN (the Minimum Discrepancy) | p (<0.05) | NFI (Normed Fit Index) | IFI (Incremental Fit Index) | RFI (Relative Fit Index) | TLI (Tacker-Lewis Index) |
|---|---|---|---|---|---|---|---|
| Delta-1 | Delta-2 | rho-1 | rho2 | ||||
| Structural weights | 19 | 43.309 | 0.001 | 0.013 | 0.014 | 0.001 | 0.001 |
| No. | Estimate (Low PDI) | Estimate (High PDI) | ΔEstimate | Whether the Influence Direction is Identical with the Research Hypotheses |
|---|---|---|---|---|
| H1a | 0.832 *** | 0.786 *** | −0.046 | Yes |
| H2a | 0.688 *** | 0.832 *** | 0.144 | No |
| H3a | p >0.05 | p >0.05 | p >0.05, The hypothesis is invalid | |
| Number | Significance | Whether the Influence Direction is Identical to the Research Hypotheses |
|---|---|---|
| H1a | Significant | Yes |
| H1b | Significant | Yes |
| H1c | Significant | Yes |
| H1d | Significant | Yes |
| H1e | Non-significant | |
| H2a | Significant | No |
| H2b | Significant | Yes |
| H2c | Significant | Yes |
| H2d | Non-significant | |
| H2e | Non-significant | |
| H3a | Non-significant | |
| H3b | Non-significant | |
| H3c | Non-significant | |
| H3d | Non-significant | |
| H3e | Non-significant | |
| H4 | Non-significant | |
| H5 | Non-significant | |
| H6 | Non-significant | |
Share and Cite
Wu, X.; Shen, J. A Study on Airbnb’s Trust Mechanism and the Effects of Cultural Values—Based on a Survey of Chinese Consumers. Sustainability 2018 , 10 , 3041. https://doi.org/10.3390/su10093041
Wu X, Shen J. A Study on Airbnb’s Trust Mechanism and the Effects of Cultural Values—Based on a Survey of Chinese Consumers. Sustainability . 2018; 10(9):3041. https://doi.org/10.3390/su10093041
Wu, Xiaojun, and Jiabin Shen. 2018. "A Study on Airbnb’s Trust Mechanism and the Effects of Cultural Values—Based on a Survey of Chinese Consumers" Sustainability 10, no. 9: 3041. https://doi.org/10.3390/su10093041
Article Metrics
Article access statistics, further information, mdpi initiatives, follow mdpi.
Subscribe to receive issue release notifications and newsletters from MDPI journals
- Asia-Pacific
- Middle-East and Africa
- Documentary
- Learn Chinese

Airbnb is moving out of China.
Starting July 30, the U.S. online rental marketplace will shut down all its listings and experiences on the Chinese mainland but will keep operating its outbound travel business. The company said the decision was made "in the face of the challenges of the pandemic." However, during the same period, Airbnb's local competitors have grown fast.
So, is the reason behind the move that simple? And after seven years of effort, why do Airbnb's bookings in China only account for about 1 percent of its overall revenue? Check out the video to find out more.
Cameraman: Qi Jianqiang
Video editor: Qi Jianqiang, Zhao Yuxiang
3D designer: Pan Yongzhe
Cover designer: Yin Yating
Chief editor: Wu Gang, Qin Xiaohu
Producer: Wen Yaru
Director: Zhang Shilei
Supervisor: Fan Yun
Search Trends
Copyright © 2020 CGTN. Beijing ICP prepared NO.16065310-3
Disinformation report hotline: 010-85061466
- Terms of use
- Privacy policy
To read this content please select one of the options below:
Please note you do not have access to teaching notes, the future of airbnb in china: industry perspective from hospitality leaders.
Tourism Review
ISSN : 1660-5373
Article publication date: 21 February 2020
Issue publication date: 8 September 2020
This study aims to investigate the development of Airbnb in China from the perspective of hospitality leaders by identifying the positive and negative effects of Airbnb development in the country.
Design/methodology/approach
A qualitative approach was adopted to explore the current development of sharing accommodation service in China. Focus group discussions were conducted with the managers and top executives of hotels in China.
Most of the participants affirmed that the experience of local culture and authenticity are the advantages of staying in this type of informal accommodation. From the viewpoint of hoteliers, traditional accommodation is necessary to rethink their strategies by providing authentic experiences. By contrast, Airbnb service may not seamlessly fit into Chinese culture. The result also indicated that there is a need for government to regulate the informal accommodation platforms.
Practical implications
This study provides views towards Airbnb from the traditional accommodation sector in Mainland China, which can contribute to the future regulation of informal accommodation services.
Originality/value
Chinese market is the leading sector in tourism industry. With the popularity of Airbnb development around the world, Airbnb is still in a developing stage in Mainland China. This study is based on 45 hoteliers and industry professionals in China, who share their views on Airbnb development and how it should move forward. The findings of this study shed light on the informal accommodation service and its future directions in China.
爱彼迎在中国的未来:酒店业领导者的行业观点
这项研究旨在从酒店业领导者的角度调查Airbnb在中国的发展, 以确定Airbnb在中国发展的正面和负面影响。
本文采用定性方法来探索中国共享住宿服务的当前发展。研究组与中国酒店的经理和高层管理人员进行了焦点小组讨论。
大多数参与者表示, 当地文化和真实性的体验是住在Airbnb这种非正式住宿中的优势。从酒店经营者的角度来看, 传统的住宿业需要重新考虑他们的经营策略, 为顾客提供真实的体验。相比之下, Airbnb的服务可能无法无缝融入中国文化。结果还表明, 政府需要规范非正式的住宿平台。
该研究提供了中国内地传统住宿业对Airbnb的看法, 这有助于未来对非正式住宿服务的监管。
中国市场是旅游业的主导市场。Airbnb在世界范围内不断普及, 而它在中国内地市场仍处于发展阶段。参与研究的45位中国酒店业者和行业专业人士, 分享了对Airbnb开发的看法以及其之后的发展方向。这项研究的结果阐明了非正式住宿服务在中国的未来发展方向。
El futuro de Airbnb en China: perspectiva de la industria desde el punto de vista de líderes hoteleros
Este estudio tiene como objetivo investigar el desarrollo de Airbnb en China desde la perspectiva de líderes hoteleros, mediante la identificación de los efectos positivos y negativos del desarrollo de Airbnb en el país.
Diseño/metodología/enfoque
Se adoptó un enfoque cualitativo para explorar el desarrollo actual del servicio de alojamiento colaborativo en China. Se llevaron a cabo discusiones de grupos focales con los gerentes y altos ejecutivos de hoteles en China.
La mayoría de los participantes afirmaron que la experiencia de la cultura local y la autenticidad, son las ventajas de alojarse en este tipo de “alojamiento informal”. Desde el punto de vista de los hoteleros, es necesario que el alojamiento tradicional, repiense sus estrategias proporcionando experiencias auténticas. Por el contrario, el servicio de Airbnb puede no encajar perfectamente en la cultura China. El resultado, también indicó que es necesario que el gobierno regule las “plataformas informales” de alojamiento.
Implicaciones prácticas
El estudio proporciona puntos de vista hacia Airbnb desde el sector de alojamiento tradicional en China continental, que puede contribuir a la futura regulación de los servicios de “alojamiento informal”.
Originalidad/valor
El mercado chino es el sector líder en la industria del turismo. Con la popularidad del desarrollo de Airbnb en todo el mundo, Airbnb aún se encuentra en una etapa de desarrollo en China continental. Este estudio se basa en 45 hoteleros y profesionales de la industria en China al compartir sus puntos de vista sobre el desarrollo de Airbnb y cómo debería avanzar. Los resultados de este estudio arrojan luz sobre el servicio de “alojamiento informal” y sus futuras direcciones en China.
- Sharing economy
- Chinese market
- Authentic experience
- Informal accommodation
- Economía Colaborativa
- Experiencia Auténtica
- Mercado Chino
- Alojamiento Informal
Qiu, D. , Lin, P.M.C. , Feng, S.Y. , Peng, K.-L. and Fan, D. (2020), "The future of Airbnb in China: industry perspective from hospitality leaders", Tourism Review , Vol. 75 No. 4, pp. 609-624. https://doi.org/10.1108/TR-02-2019-0064
Emerald Publishing Limited
Copyright © 2020, Emerald Publishing Limited
Related articles
All feedback is valuable.
Please share your general feedback
Report an issue or find answers to frequently asked questions
Contact Customer Support
- DOI: 10.1371/journal.pone.0248647
- Corpus ID: 232304349
Characteristics and influencing factors of Airbnb spatial distribution in China’s rapid urbanization process: A case study of Nanjing
- Shijie Sun , Shengyue Zhang , Xing-min Wang
- Published in PLoS ONE 18 March 2021
- Geography, Economics, Business
Figures and Tables from this paper

10 Citations
Spatial patterns and determinants of bed and breakfasts in the all-for-one tourism demonstration area of china: a perspective on urban–rural differences, spatiotemporal patterns and socioeconomic influences on host participation in short-term rental markets: airbnb in san francisco, is the effect of airbnb on the housing market different in medium-sized cities evidence from a southern european city, analysis of airbnb’s green user emotional characteristics: how do human, geographical, housing, and environmental factors influence green consumption, an analysis of apartment listings in best destinations on an ota: thailand versus japan, research on design strategy of b&b: based on text mining and machine learning method, built environment and airbnb spatial distribution in hong kong: a case study considering the spatial heterogeneity and multiscale effects, understanding the determinants of where and what kind of home accommodation to build, inside airbnb titles: the location choices of listings from chinese hosts' advertising expressions, which came first, the gentrification or the airbnb identifying spatial patterns of neighbourhood change using airbnb data, 44 references, study of the impact of a high-speed railway opening on china’s accessibility pattern and spatial equality, the eruption of airbnb in tourist cities: comparing spatial patterns of hotels and peer-to-peer accommodation in barcelona, spatial distribution and location characteristics of airbnb in seoul, korea.
- Highly Influential
The influence of neighbourhood environment on Airbnb: a geographically weighed regression analysis
The influence of high-speed rail on ice–snow tourism in northeastern china, on the determinants of airbnb location and its spatial distribution, assessing airbnb logistics in cities: geographic information system and convenience theory, what is happening in paris airbnb, hotels, and the parisian market: a case study, airbnb, buy-to-let investment and tourism-driven displacement: a case study in lisbon, exploring the socio-spatial inequalities of airbnb in sofia, bulgaria, related papers.
Showing 1 through 3 of 0 Related Papers
Pardon Our Interruption
As you were browsing something about your browser made us think you were a bot. There are a few reasons this might happen:
- You've disabled JavaScript in your web browser.
- You're a power user moving through this website with super-human speed.
- You've disabled cookies in your web browser.
- A third-party browser plugin, such as Ghostery or NoScript, is preventing JavaScript from running. Additional information is available in this support article .
To regain access, please make sure that cookies and JavaScript are enabled before reloading the page.
China leads the world in adoption of generative AI, survey shows
- Medium Text

Sign up here.
Reporting by Eduardo Baptista in Beijing; Additional reporting by Liam Mo; Editing by Clarence Fernandez
Our Standards: The Thomson Reuters Trust Principles. New Tab , opens new tab

Technology Chevron

TotalEnergies, SSE to launch EV charging company in UK and Ireland
French oil major TotalEnergies and UK power firm SSE are seeking to grab a 20% share of the electric vehicle (EV) fast-charging market in Britain and Ireland by launching a joint venture named Source, the companies said on Tuesday.

Thank you for visiting nature.com. You are using a browser version with limited support for CSS. To obtain the best experience, we recommend you use a more up to date browser (or turn off compatibility mode in Internet Explorer). In the meantime, to ensure continued support, we are displaying the site without styles and JavaScript.
- View all journals
- Explore content
- About the journal
- Publish with us
- Sign up for alerts
- Open access
- Published: 10 July 2024
Assessing land-use changes and carbon storage: a case study of the Jialing River Basin, China
- Shuai Yang 1 ,
- Liqin Li 2 ,
- Renhuan Zhu 3 , 4 ,
- Chao Luo 5 ,
- Xiong Lu 6 ,
- Mili Sun 2 &
- Benchuan Xu 7
Scientific Reports volume 14 , Article number: 15984 ( 2024 ) Cite this article
189 Accesses
Metrics details
- Environmental sciences
Land-use change is the main driver of carbon storage change in terrestrial ecosystems. Currently, domestic and international studies mainly focus on the impact of carbon storage changes on climate, while studies on the impact of land-use changes on carbon storage in complex terrestrial ecosystems are few. The Jialing River Basin (JRB), with a total area of ~ 160,000 km 2 , diverse topography, and elevation differences exceeding 5 km, is an ideal case for understanding the complex interactions between land-use change and carbon storage dynamics. Taking the JRB as our study area, we analyzed land-use changes from 2000 to 2020. Subsequently, we simulated land-use patterns for business-as-usual (BAU), cropland protection (CP), and ecological priority (EP) scenarios in 2035 using the PLUS model. Additionally, we assessed carbon storage using the InVEST model. This approach helps us to accurately understand the carbon change processes in regional complex terrestrial ecosystems and to formulate scientifically informed land-use policies. The results revealed the following: (1) Cropland was the most dominant land-use type (LUT) in the region, and it was the only LUT experiencing net reduction, with 92.22% of newly designated construction land originating from cropland. (2) In the JRB, total carbon storage steadily decreased after 2005, with significant spatial heterogeneity. This pattern was marked by higher carbon storage levels in the north and lower levels in the south, with a distinct demarcation line. The conversion of cropland to construction land is the main factor driving the reduction in carbon storage. (3) Compared with the BAU and EP scenarios, the CP scenario demonstrated a smaller reduction in cropland area, a smaller addition to construction land area, and a lower depletion in the JRB total carbon storage from 2020 to 2035. This study demonstrates the effectiveness of the PLUS and InVEST models in analyzing complex ecosystems and offers data support for quantitatively assessing regional ecosystem services. Strict adherence to the cropland replenishment task mandated by the Chinese government is crucial to increase cropland areas in the JRB and consequently enhance the carbon sequestration capacity of its ecosystem. Such efforts are vital for ensuring the food and ecological security of the JRB, particularly in the pursuit of the “dual-carbon” objective.
Spatio-temporal evolution and driving factors of carbon storage in the Western Sichuan Plateau

Carbon sinks and carbon emissions balance of land use transition in Xinjiang, China: differences and compensation

Analysis of carbon emissions from land cover change during 2000 to 2020 in Shandong Province, China
Introduction.
Land, as the primary arena for human activities, has undergone drastic changes owing to accelerating socioeconomic development, urbanization processes, and natural transformations by human beings 1 , 2 . Land-use change forms the foundation of the study of carbon storage in terrestrial ecosystems, as it directly impacts the original pattern, process, function, and structure of terrestrial ecosystems, thereby altering their carbon storage 3 , 4 . This directly affects climate change predictions, greenhouse gas emissions, and reduction efforts 4 . In the context of the overall spatial planning of the national territory, basins are open and composite systems and the basic unit of a complete ecosystem; moreover, the natural, economic, social, and cultural elements within basins are closely interconnected. Furthermore, basins are characterized by diverse natural landscapes, clear hierarchical structures, and holistic characteristics 2 . Taking a basin as a research area breaks traditional administrative boundaries. This approach allows for seeking optimal solutions for basin development that balance food production, ecology, environment, and other objectives, contributing to national ecological security construction 5 . Therefore, analyzing land-use changes in basins, predicting future land-use patterns, and quantitatively assessing ecosystem carbon storage are essential for achieving balanced development with multiple objectives in regions characterized by basins 6 .
Land-use simulation models are essential tools for studying future land-use dynamics. These models include quantitative models such as Markov 7 , linear prediction 8 , system dynamics 9 , gray prediction 10 models, and spatial models such as patch-generating land use simulation (PLUS) 11 , future land use simulation (FLUS) 12 , cellular automaton (CA) 7 , and conversion of land use and its effects at small regional extent (CLUE-S) 13 . The PLUS model compensates for the shortcomings of the CA and CLUE-S models by effectively identifying the driving factors of land-use change and capturing the evolutionary patterns of various patch types. The model enhances the roulette wheel competition process and adaptive inertia within the FLUS model. Moreover, the integrated random forest algorithm of the model can effectively handle spatial autocorrelation and multicollinearity among the driving factors 11 , 14 . Consequently, the PLUS model can more accurately simulate various future land use scenarios and is extensively utilized 11 , 15 . The Markov model is widely used to predict future land-use demand by calculating the conversion probability between different land-use types (LUTs) over time 16 , 17 , 18 . Among all carbon storage assessment methods, the ecosystem functional state assessment and analysis model represented by Integrated Valuation of Ecosystem Service and Tradeoffs (InVEST) is highly regarded by scholars owing to the easy access to driving data, simple and convenient operation, high precision in quantitative assessment, and clear spatial representation of the assessment process and results 19 , 20 . The integration of PLUS, Markov, and InVEST models can enable the optimization of spatial layout, the quantitative structure of regional land-use, and the exploration of future carbon storage changing rules in terrestrial ecosystems.
The Jialing River Basin (JRB) connects the Guanzhong Plain urban agglomeration and the Lanxi urban agglomeration in the north and the Chengdu–Chongqing urban agglomeration in the south. It holds a crucial position in the Yangtze River Economic Belt and the Silk Road Economic Belt. As one of China’s most important grain-producing regions, the JRB is densely cultivated. The JRB is an essential part of the ecological barrier, a significant water source region, and a key area for biodiversity protection in the upper reaches of the Yangtze River in China. However, it is significantly affected by economic development and urbanization under the national macro-policy, leading to drastic land-use changes in the JRB. These changes bring about a series of challenges to food production and ecological security 21 , 22 , 23 . Carbon storage in terrestrial ecosystems plays a crucial role as carbon sinks. However, changes in carbon storage are primarily influenced by LUT conversion. The carbon sequestration function of terrestrial complex ecosystems has been consistently strengthened through the regulation of LUT conversion, which will aid China in realizing its “dual-carbon” goals. Studying the JRB land-use changes and their impact on carbon storage is vital. Although there have been numerous studies on the effects of land-use/cover changes or human activities on hydrological conditions 24 , soil erosion 25 , biodiversity 26 , and environmental pollution 23 in the JRB, there is a lack of up-to-date studies on historical land-use or carbon storage changes and future land-use simulations or carbon storage assessments.
With the JRB as our research area, our objectives are as follows: (1) reveal the changing patterns of land use at the basin scale; (2) predict land-use status under business-as-usual (BAU), cropland protection (CP), and ecological priority (EP) scenarios in 2035 using the PLUS and Markov models; (3) assess carbon storage from 2000 to 2020 and in 2035 under different scenarios using the InVEST model; and (4) investigate carbon storage distribution and aggregation characteristics from 2000 to 2020 through global spatial autocorrelation analysis (Moran’s I), clustering and outlier analysis (Anselin Local Moran’s I), and cold-hotspot analysis (Getis-Ord G i *). This research aims to provide essential data support for achieving sustainable development in the JRB. Our study revealed that cropland, being the most prominent and the only LUT transferred out of the JRB, is in direct competition with construction land. To realize the coordinated ecological, social, and economic development of the JRB, it is imperative to implement CP policies, increase afforestation and grass-planting efforts, and strictly enforce urban development boundaries.
Materials and methods
The Jialing River is a primary tributary of the upper reaches of the Yangtze River on the left bank, with a total length of 1,345 km. Its water system has a dendritic shape, and most of it flows through the eastern part of the Sichuan Basin, eventually joining the Yangtze River at Chaotianmen in the Yuzhong District of Chongqing Municipality 25 , 27 . Covering a total area of ~ 160,000 km 2 , the JRB (longitude 102° 31′ 51″–109° 16′ 34″, latitude 29° 17′ 29″–34° 31′ 44″) constitutes ~ 9% of the Yangtze River Basin. It spans Shaanxi, Gansu, Sichuan, and Chongqing (Fig. 1 ) 28 .

Location and terrain of the study area.
The JRB is situated in the transition zone from the Qinghai–Tibet Plateau to China’s second-tier terrain, characterized by complex and varied topography. It encompasses the plateau region, mountainous region, hilly region, and basin region, displaying distinct geographic zoning characteristics. The JRB terrain tilts roughly from northwest to southeast, exhibiting a significant gradient change. The elevation difference across the entire JRB exceeds 5 km, resulting in dramatic topographical variations. The river course aligns with the terrain, leading to an elevation difference in the river of ~ 2.3 km and an average drop ratio of 2.05‰ 29 . The JRB traverses multiple climate zones, including the Tibetan Plateau, temperate monsoon, and subtropical monsoon regions. These climate zones exhibit distinct characteristics, with hot and rainy summers and warm and humid winters. The multi-year average daily maximum and minimum temperatures in the JRB are 19.4 °C and 4.3 °C, respectively 30 . Precipitation in the JRB follows a spatial distribution pattern that decreases from southeast to northwest. The multi-year average, maximum, and minimum precipitation levels are 935 mm, 1,283 mm, and 643 mm, respectively 28 , 29 .
Data sources
Land-use data and its driving factors.
The standard Chinese map with the approval number of GS(2024)0650 No. was obtained from the National Platform for Common GeoSpatial Information Services ( https://www.tianditu.gov.cn/ ). Data for the Jialing River, Yangtze River, and their respective basins were provided by the National Cryosphere Desert Data Center ( https://www.ncdc.ac.cn ). Land-use data were obtained from the Resource and Environment Science and Data Center of the Chinese Academy of Sciences ( https://www.resdc.cn ). This dataset includes six primary land classes, such as cropland and forestland, and 24 secondary land classes, including paddy fields and dry land. Using ArcGIS 10.3 software, we cropped the data according to the vector range of the JRB and reclassified them into six LUTs: cropland, forestland, grassland, water, construction land, and unused land. Subsequently, we generated five land-use raster maps of the JRB for years 2000, 2005, 2010, 2015, and 2020. Drawing upon relevant studies 1 , 16 , 31 , 32 , we selected 19 driving factors encompassing both natural environmental and socioeconomic aspects. Among these, average annual temperature, average annual precipitation, total phosphorus, total potassium, total nitrogen, and soil organic matter were obtained from the National Tibetan Plateau Data Center ( https://data.tpdc.ac.cn ) and the National Earth System Science Data Center ( https://www.geodata.cn ). Digital elevation model (DEM) data were sourced from the Geospatial Data Cloud ( https://www.gscloud.cn ), while slope data were calculated from the DEM data using ArcGIS 10.3 software. Gross domestic product, population density, and nighttime lighting data were retrieved from the Resource and Environment Science and Data Center of the Chinese Academy of Sciences ( https://www.resdc.cn ). County (city and district) governmental location data were obtained from OpenStreetMap ( https://www.openstreetmap.org ), and data related to railways, Class I–IV roads, rivers, and settlements were acquired from the National Catalogue Service For Geographic Information ( https://www.webmap.cn ). Using ArcGIS 10.3 software, the projection coordinate system of the land-use data and data on the natural environment and socioeconomic factors were standardized to CGCS2000_GK_Zone_18. Subsequently, the data on roads, rivers, settlements, and county (city and district) governmental sites were subjected to Euclidean distance analysis. All data were converted into raster data (.tif) with a spatial resolution of 30 m × 30 m.
Carbon density data
According to the methodologies outlined by Li et al. 33 , Zhang et al. 34 , Wang et al. 35 , and Xiang et al. 36 for determining carbon density, we collated four datasets on carbon density: Dataset 1 comprised experimentally determined carbon density data on the JRB and its neighboring regions. A dataset on carbon density in Chinese terrestrial ecosystems (2010s) 37 obtained from the Institute of Geographic Sciences and Natural Resources Research of the Chinese Academy of Sciences was processed in ArcGIS 10.3 to extract carbon density measurements in the study area and its surroundings. In addition, we utilized carbon density data obtained by Xia et al. 38 and Xia et al. 39 . Dataset 2 comprised carbon density data on the JRB, and it was collected from Zhang et al. 40 . Dataset 3 comprised carbon density data on the surrounding areas of the JRB, and it was collected from Xiang et al. 36 . The data were corrected for carbon density using the mean annual temperature and mean annual precipitation correction models 41 . Dataset 4 comprised carbon density data on the climatic zone of the study area, and it was collected from Liu et al. 42 . Finally, we analyzed the collected carbon density data to remove outliers, and then took the average of the carbon density of each component for each LUT as the carbon pool data for the InVEST model (Table 1 ).
The research flowchart of the simulation and assessment of land-use changes and carbon storage in this paper is shown in Fig. 2 .

The research framework of this study.
Multi-scenario setting
According to policy documents such as the Territorial Spatial Plan (2021–2035) of Shaanxi Province, Gansu Province, Sichuan Province, and Chongqing Municipality (municipalities directly under the central government) where the JRB is situated, we established the simulation timeframe for future land use in the JRB as the year 2035. The JRB, an important ecological reserve and grain-producing region in the upper reaches of the Yangtze River, predominantly consists of cropland, forestland, and grassland as its land use types. Drawing on the land use scenario simulation studies conducted by Zhang et al. 40 within the JRB and by Yang et al. 43 in the surrounding areas, we established the BAU, CP, and EP scenarios for the future land use of the JRB. The specifics of these scenarios are described as follows:
The BAU scenario was constructed based on land-use change ratios, socioeconomic factors, and natural environmental drivers from 2015 to 2020, without considering policy planning constraints. The Markov model was employed to predict the future demand for various LUTs, and the LUT demand served as a parameter for land-use demand in the PLUS model 2 . This scenario formed the basis for setting other scenarios.
The CP scenario was built upon the BAU scenario according to the setup parameters presented in Li et al. 19 , Wang et al. 44 , and Li et al. 45 . In this scenario, the Markov transfer probability matrix was adjusted. The conversion probability of cropland to construction land was reduced by 65% to rigorously enforce CP policies.
The EP scenario was developed based on the BAU scenario according to the setup parameters presented in Li et al. 16 , Wang et al. 44 , and Li et al. 45 . In this scenario, through the modification of the Markov transfer probability matrix, the conversion probabilities of forestland and grassland to construction land were 50% lower than that in the BAU scenario, while the conversion probability of water to construction land was 30% lower. Additionally, the ecological capacity of cropland was weaker than that of forestland. Therefore, the probability of cropland being converted into construction land was 25% lower than that in the BAU scenario.
Markov model
The Markov model, based on the Markov chain process, is a statistical method for predicting future probability, and it is characterized by the non-aftereffect property, stochasticity, discreteness, and stationarity 16 , 46 . It predicts future land-use change trends using initial state and transfer probability matrices 19 . The formula for the model is as follows:
where \({S}_{t}\) and \({S}_{t+1}\) are the land-use states at \(t\) and \(t+1\) , respectively; \({P}_{ij}\) is the transfer probability of LUT \(i\) to \(j\) during the study period.
To minimize errors generated by the Markov model in long time series, in this study, the LUT demand under each scenario was predicted sequentially at five-year intervals, that is, for 2025, 2030, and 2035.
PLUS model, key parameter setting, model validation
The PLUS model enables the generation of land-use change simulations using raster data patches, allowing for the exploration of causal factors influencing various LUT changes and the simulation of changes at the patch level 11 . This model comprises two modules: a rule-mining framework based on a land expansion analysis strategy (LEAS) and a CA model based on multi-type random patch seeds (CARS) 11 . The LEAS module can extract and sample land-use expansion between two periods of land-use change, employing the random forest algorithm to mine and acquire development probabilities and the contribution ratios of drivers for various LUTs 47 . Under the constraints of development probabilities, the CARS module simulates the automatic generation of patches by combining randomly generated seeds and employing decreasing threshold mechanisms 48 .
Neighborhood weight setting
Neighborhood weight indicates the expansion capacity of various LUTs, with values ranging from 0 to 1 19 . This study determined the parameters for neighborhood weights for different scenarios according to the expansion area share of various LUTs 49 , combined with insights from related studies (see Table 2 ) 33 , 50 .
Cost matrix setting
A cost matrix represents the conversion rules between various LUTs. A matrix value of 0 is assigned when one LUT cannot be converted into another, and a matrix value of 1 is assigned when the opposite is true. Table 3 presents the cost matrices for different scenarios.
Restricted region setting
In different scenarios, the river water surface was transformed into a binary image, with 0 indicating the non-transformable region and 1 indicating the transformable region. These images were then input into the PLUS model as restricted factors.
PLUS model validation
To assess the accuracy of land-use simulation results, overall accuracy (OA), and the figure of merit (FoM) coefficient were employed. An OA approaching 1 indicates higher simulation accuracy, with an OA value of > 0.75 indicating a reliable simulation 48 , while a smaller FoM value indicates higher simulation accuracy 51 . The formula for FoM is as follows 52 :
where Misses is the area of error due to reference change simulated as persistence; Hits is the area correctly identified as change resulting from reference change; Wrong Hits is the area of error due to reference change simulated as change to the wrong category; False Alarms is the area of error due to reference persistence simulated as change.
Consequently, based on land-use data from 2015, the simulation data for 2020 generated by the PLUS model prediction were compared with the actual data. The results revealed an OA of 0.9961, and an FoM coefficient of 0.0232, indicating that the model can accurately simulate future land-use changes in the JRB.
- Carbon storage
- InVEST model
The carbon module of the InVEST model assumes that various LUTs correspond to total carbon density, which consists of belowground carbon density, aboveground carbon density, dead organic matter carbon density, and soil organic matter carbon density. The model considers the carbon density of various LUTs to be constant 53 . The calculation formula is as follows:
In formulas ( 3 ) and ( 4 ), \(i\) denotes the i -th LUT; \({C}_{i}\) is the total carbon density of LUT I ; \({C}_{i-above}\) , \({C}_{i-below}\) , \({C}_{i-dead}\) , and \({C}_{i-soil}\) are the aboveground, belowground, dead organic matter, and soil organic matter carbon densities of LUT I , respectively; \({C}_{i-total}\) is the total carbon storage of LUT I ; n is the total number of LUTs; and \({S}_{i}\) is the area of LUT I .
Spatial correlation analysis
Spatial autocorrelation is a common method used to test whether the attribute values of elements are spatially correlated and the degree of spatial relevance 49 . This measure helps identify the extent to which attributes are clustered or dispersed. According to previous studies 49 , 54 , 55 , to account for the actual conditions in the JRB and the complexity of data processing, a grid of 9 km × 9 km was generated, along with grid points within the study area, using ArcGIS 10.3. Carbon storage data were linked with the grid to obtain the carbon storage value for each grid point. At the grid scale, global autocorrelation results were derived by calculating the spatial autocorrelation Global Moran’s I index. Subsequently, outlier or clustering location maps (i.e., local indicators of spatial association [LISA] clustering maps) were generated through clustering and outlier analysis. Finally, cold-hotspot analysis was employed to study the spatial distribution pattern of high-value and low-value carbon storage clusters in the JRB, aiding in the detection of unusual events. Detailed formulas and additional information on spatial autocorrelation analysis can be found in the literature 56 , 57 .
Land-use changes, 2000–2020
From 2000 to 2020, the JRB was primarily composed of cropland, forestland, and grassland, accounting for more than 43%, 32%, and 21% of the total basin area, respectively (Table 4 ). The remaining LUTs covered smaller areas, each accounting for less than 2% of the total basin area. Each LUT area underwent varying degrees of change, with the most significant change occurring in cropland areas, which continued to decrease, resulting in a total reduction of 1536.98 km 2 or 2.16%. Conversely, the water and construction land areas continued to increase, with additional values of 107.24 and 1087.94 km 2 , representing increases of 6.77% and 66.40%, respectively. The areas of forestland, grassland, and unused land also generally increased, with additional values of 239.89, 49.10, and 52.81 km 2 , corresponding to increases of 0.46%, 0.14%, and 11.10%, respectively. These changes were primarily due to rapid urbanization in the JRB, leading to significant encroachment of construction land on cropland. Additionally, the national policy of “returning cropland to forest for grass” resulted in the conversion of cropland to forestland and grassland. Moreover, the state’s comprehensive promotion of ecological restoration and protection in the Yangtze River Basin played a crucial role in increasing the water area.
Cropland was mainly concentrated in the Sichuan Basin in the south of JRB, and it was also distributed in the eastern, northern, and central regions (Fig. 3 ). Forestland was predominantly situated in the mountainous areas surrounding the Sichuan Basin, as well as in the middle and upper reaches of the JRB. Grassland was mainly found in the middle and upper reaches of the JRB. Construction land was primarily located on both sides of the river in the middle and lower reaches of the JRB, while unused land was situated at higher elevations in the northwest of the basin.

Land-use spatiotemporal distribution in the JRB from 2000 to 2020.
A total of 1673.27 km 2 of cropland in the JRB underwent changes from 2000 to 2020, with 61.11% of cropland being converted into construction land, while 136.29 km 2 was transformed into cropland (Fig. 4 ). Forest land experienced an addition of 451.75 km 2 and a loss of 211.86 km 2 . Grassland experienced an addition of 377.70 km 2 and a loss of 328.59 km 2 . Water area experienced an addition of 116.82 km 2 and a loss of 9.58 km 2 . Construction land experienced an addition of 1108.84 km 2 , of which 92.22% was from cropland, and a loss of 20.91 km 2 . The net increase in the areas of forestland, grassland, water, and construction land accounted for 15.61%, 3.19%, 6.98%, and 70.78% of the total net increase in area, respectively. This indicates that the significant decrease in cropland area was primarily due to its conversion into construction land. The conversion of forestland and grassland into cropland also contributed to the decrease in cropland area.

Sankey map of land-use transfer for the JRB, 2000–2020 (km 2 ).
Carbon storage spatiotemporal changes, 2000–2020
Carbon storage in the JRB first increased and then decreased over the years from 2000 to 2020, reaching its peak in 2005 (Table 5 ). The carbon storage values in 2000, 2005, 2010, 2015, and 2020 (i.e., five-year intervals) were 2,231.06, 2,232.98, 2,232.10, 2,228.94, and 2,227.18 × 10 6 t, respectively. This represents a total decrease of 3.88 × 10 6 t, with an average decrease of 0.17%. Carbon storage changes differed among various LUTs. Cropland, forestland, and grassland were the most essential carbon pools in the JRB, each accounting for more than 30% of the total carbon storage. Together, they comprised over 98% of the total carbon storage, and their combined values continued to decrease over time. The combined highest and lowest carbon storage values of these three LUTs were 2,197.85 × 10 6 (in 2000) and 2,186.85 × 10 6 t (in 2020), representing 98.51% and 98.19% of the total, respectively. Cropland carbon storage decreased by 2.16% from 2000 to 2020, while water and construction land carbon storage increased by 6.77% and 66.40%, respectively, from 2000 to 2020. The carbon storage of forestland, grassland, and unused land initially increased and then decreased over the years from 2000 to 2020, with overall increases of 0.46%, 0.14%, and 11.10%, respectively.
The distribution of carbon storage was strongly correlated with LUT (Fig. 5 ), with higher carbon storage values in the north and lower values in the south. High-value regions were predominantly located in the northwestern and northern mountainous regions, while low-value regions were mostly situated in the hilly areas of the Sichuan Basin.

Spatiotemporal distribution of carbon storage in the JRB from 2000 to 2020.
Different LUT conversions impacted carbon storage owing to the effects of various LUT transfers and differences in carbon density (Fig. 6 ). Among these, the carbon storage changes in cropland, forestland, grassland, water, and construction land accounted for 71.70%, 8.79%, 17.90%, 0.32%, and 1.02% of the total changes, respectively. Carbon storage changes in cropland from 2000 to 2020 primarily reflected the conversion of cropland into construction land, grassland, and forestland. Carbon storage changes in forestland mainly resulted from the conversion of forestland into construction land, cropland, and grassland. Carbon storage changes in grassland were mainly driven by the conversion of grassland into forestland, cropland, and construction land. Carbon storage changes in water mainly stemmed from the conversion of water into construction land and grassland. Carbon storage changes in construction land were primarily due to conversions into cropland, forestland, and water.

( a ) Proportions of carbon storage variation and ( b ) carbon storage variations in the conversions of different LUTs in the JRB, 2000–2020.
Carbon storage spatial correlation analysis from 2000 to 2020
Global spatial autocorrelation analysis of the JRB carbon storage was conducted to obtain the Global Moran’s I index for the five time points from 2000 to 2020 (Table 6 ). Under a 0.01 significance test level, the Z -score values for 2000, 2005, 2010, 2015, and 2020 were all greater than the test threshold value of 2.58, indicating a highly significant result. The Global Moran’s I index values of 0.9076, 0.9078, 0.9089, 0.9081, and 0.9094 for 2000, 2005, 2010, 2015, and 2020 were > 0, indicating that the spatial distribution of the JRB carbon storage exhibited apparent aggregation. The Global Moran’s I index gradually increased over time, reaching extremely high values in 2010 and 2020, suggesting that the spatial distribution of carbon storage in the JRB showed fluctuating but overall strengthening agglomeration trends.
To further analyze the spatial clustering patterns of carbon storage distribution in the JRB, a spatial LISA clustering map was constructed using local autocorrelation analysis (Fig. 7 ). The clustering of carbon storage was characterized by high levels in the north and low levels in the south. The “high–high” clustering region was relatively scattered, mainly distributed in JRB’s northwestern area. The “low–low” clustering region was more concentrated, mainly in JRB’s middle and lower reaches. Neither the “high–high” nor the “low–low” clustering regions changed significantly over time.

LISA agglomeration diagram of carbon storage in the JRB, 2000–2020.
To further investigate the spatial location and degree of high-value and low-value clusters of carbon storage in the JRB, a cold-hotspot analysis was conducted (Fig. 8 ). The results indicated that the cold spots and hot spots of carbon storage in the JRB were clustered with significant cold-hotspot effects and had a high degree of spatial differentiation. No transformation occurred between cold spots and hot spots. Carbon storage hot spots were distributed relatively scatteredly, mainly in JRB’s upper and northwestern regions. This distribution was primarily due to forestland and grassland dominating the region, with significant terrain undulations, high elevation, relatively low temperature, and precipitation. The state vigorously implemented ecosystem protection and restoration measures in the region, resulting in a rich and high coverage of vegetation types. Carbon storage cold spots were concentrated and stable, distributed in JRB’s middle and lower reaches in a centralized manner. This concentration was attributed to the region’s flat terrain and the presence of extensive agricultural lands in the Chengdu–Chongqing economic circle in southwest China. Strong human activities and rapid urban development in the region led to the spread of urban living space, directly encroaching upon cropland, which served certain ecological functions, and forestland, grassland, and other ecological lands.

Cold-spot and hot-spot distribution of carbon storage in the JRB from 2000 to 2020.
Land use and carbon storage changes under various scenarios
A study of land use and carbon storage in the JRB from 2020 to 2035 revealed (Figs. 9 and 10 ) that under different scenarios, the area of water and construction land and their carbon storage increased, while that of the remaining LUTs decreased. These changes mostly occurred in the hilly regions of the Sichuan Basin in JRB’s middle and lower reaches, and the spatial distribution of LUTs and carbon storage generally remained the same.

Changes in land-use area and carbon storage under various scenarios in the JRB, 2020–2035. ( a ) LUT area change; ( b ) percentage of LUT area change; ( c ) carbon storage change.

Land-use and carbon storage spatial distribution of the JRB in 2035 under various scenarios. ( a ), ( b ), and ( c ) were land-use spatial distribution under the BAU scenario, the CP scenario, and the EP scenario, respectively; ( d ), ( e ), and ( f ) were carbon storage spatial distribution under the BAU scenario, the CP scenario, and the EP scenario, respectively.
Under the BAU scenario, the area of construction land increased by 769.38 km 2 (or 28.22%) over time from 2020 to 2035, while cropland, forestland, and grassland areas decreased by 637.18, 164.05, and 17.09 km 2 , or 0.91%, 0.32%, and 0.05%, respectively (Fig. 9 a,b). Carbon storage reduction driven by the conversion from cropland and forestland into other LUTs was 6.44 × 10 6 and 2.40 × 10 6 t, respectively (Fig. 9 c). Carbon storage increased by only 3.53 × 10 6 t owing to construction land expansion, and JRB’s total carbon storage decreased by 5.18 × 10 6 t. Without any policy constraints, construction land expansion was mainly based on the status quo of the original distribution, and construction land continued to extend along the river bank (Figs. 3 e and 10 a), mainly occupying cropland, forestland, and other LUTs with ecological functions to meet socioeconomic development needs. Cropland and forestland became the main areas converted into other LUTs, posing risks to food production and ecological security.
Under the CP scenario, construction land area increased by 275.21 km 2 (or 10.09%) compared with construction land area in 2020, while cropland, forestland, and grassland area decreased by 142.46, 164.56, and 17.15 km 2 , or 0.20%, 0.32%, and 0.05%, respectively (Fig. 9 a,b). Carbon storage decreased by 2.41 × 10 6 and 1.44 × 10 6 t owing to the loss of forestland and cropland, respectively, and increased by 1.26 × 10 6 t owing to an increase in construction land (Fig. 9 c). The total decrease in carbon storage in the JRB (2.45 × 10 6 t) was smaller than those of other scenarios. Most basin cropland was in direct spatial competition with construction land because they were distributed close to each other (Figs. 3 e and 10 b). Therefore, cropland protection corresponded to constrained construction land development. Overall, the CP scenario slowed down cropland conversion while having positive effects on ecological protection.
Under the EP scenario, forestland and grassland areas decreased by 141.71 km 2 (or 0.27%) and 7.88 km 2 (or 0.02%), respectively, over time from 2020 to 2035 (Fig. 9 a,b). Although construction land expansion was pronounced, the expansion rate decreased significantly from 28.22% (the BAU scenario) to 20.03%. Cropland area still decreased, but its decrease amount dropped from 0.91% (the BAU scenario) to 0.64%. The conversions of cropland and forestland resulted in carbon storage reductions of 4.52 × 10 6 and 2.08 × 10 6 t, respectively, while construction land expansion resulted in a carbon storage increase of 2.51 × 10 6 t (Fig. 9 c). Compared with the BAU scenario, the basin’s carbon storage value impairment was lower, at 3.74 × 10 6 t. From the spatial development pattern of LUTs, the decrease in cropland area mainly occurred near construction land (Figs. 3 e and 10 c). In general, under the EP scenario, the conversion of ecological land such as forestland and grassland was somewhat restricted; consequently, cropland was the main type of land that experienced conversion, while reducing construction land encroachment on ecological land contributed to the preservation of the JRB ecological security.
Land-use changes
This paper shows that JRB’s land-use spatial distribution is characterized by evident differentiation. Forestland and grassland are mainly found in JRB’s upper and middle reaches, while cropland and construction land are mostly distributed in JRB’s middle and lower reaches. Similar findings were reported by Xiao et al. 58 for the Yellow River Basin (Henan section) and Wang et al. 59 for the Taihang Mountains. The JRB spans several complex topographic and geomorphic regions, including plateaus, mountains, hills, and basins, with temperature and precipitation gradually increasing from northwest to southeast. Elevation gradually decreases as the river flows. The JRB middle and lower reaches are located in the Sichuan Basin hilly regions, where the terrain is relatively flat, facilitating agricultural and economic activities.
The study found that cropland was the only LUT that decreased in area. Previous studies have suggested that cropland was the LUT that experienced an increase, while only LUTs experienced a decrease, including forestland and unused land 1 , 17 , 41 . The main reason for this trend in the JRB, an important water source and ecological barrier in the upper reaches of the Yangtze River, is the systematic implementation of ecological fallowing measures by the government since 1999. These measures include converting cropland to forests, grasslands, and water bodies. Additionally, the development of transportation infrastructure and towns, the expansion of rural residential areas, and the continuous growth of garden land have all contributed to the reduction of cropland area.
Currently, scholars are in dispute over the results of land-use simulations under various scenarios. For example, Wei et al. 17 estimated that in the Ebinur Lake Basin, China, cropland and construction land areas increased significantly over time from 2020 to 2030 under the BAU scenario, while forestland decreased. Conversely, under the EP scenario, cropland and construction land areas decreased, while forestland area increased considerably. Wang et al. 44 estimated that in the Guangdong–Hong Kong–Macao Greater Bay Area, under the BAU scenario, cropland and forestland areas decreased over time from 2020 to 2030, while construction land and grassland areas increased, and under the CP scenario, cropland, grassland, and construction land areas increased. Yang et al. 43 estimated that in Xi’an City, China, under the EP scenario, cropland area decreased over time from 2015 to 2030, while construction land, forestland, and grassland areas increased, and under the CP scenario, construction land area increased, while cropland, forestland, and grassland areas decreased. Our study results show that cropland, forestland, and grassland areas decreased under different scenarios, while construction land area increased significantly, with the smallest amplification in construction land under the CP scenario. A comparison of these studies reveals differences in policies related to territorial spatial planning, economic and social development, and ecological conservation in various study areas. These differences affect the setting of land-use transfer probabilities. Substantial variations in the initial land-use patterns and land-use transfer probabilities in the different study areas lead to differences in land-use simulation results under different scenarios.
Carbon storage changes
Carbon storage in the JRB initially increased and then decreased over time from 2000 to 2020, a trend that aligns with the findings of Gong et al. 4 and Chen et al. 60 . This pattern is primarily attributed to the policy implementation of returning farmland to forests since 2003, resulting in the conversion of cropland to forestland and an increase in carbon storage. However, as urbanization accelerates, rural populations migrate to towns and cities, leading to the expansion of urban boundaries and the constant encroachment into ecologically functional lands around towns and cities. The urban boundaries encroach into a large area of cropland and small areas of forestland and grassland. This ultimately results in a continuous decline in carbon storage.
Our study results show that JRB’s carbon storage was aggregated and generally increased over time; however, the JRB featured no “high–low” or “low–high” clustering region, whereas scholars 32 , 33 , 61 , 62 reported “high–low” and “low–high” clustering patterns for different study regions. Carbon storage high-value and low-value clustering reveal clear distribution boundaries between cold spots and hot spots according to their spatial distribution pattern. These findings differ from those of previous research; for example, Li et al. 33 reported spatial aggregation of carbon storage in Kunming City with fluctuating changes over time. Liang et al. 7 found that cold spots and hot spots in carbon storage on the Loess Plateau represented a small percentage of the total. The cold spots and hot spots exhibited a mosaic and decentralized distribution 7 , 33 . Lin et al. 61 found that the spatial distribution of carbon storage in Guangdong exhibited clustering phenomena, with the degree of agglomeration initially increasing and then decreasing over time. However, the distribution of cold spots and hot spots was scattered, and distinct demarcation lines were lacking. The topography in the northwest of the region is higher, while the southeast of JRB features lower terrain. In the upper reaches of the Jialing River, the landscape consists of meandering courses with deep valleys, whereas the middle reaches exhibit flatter terrain, transitioning from deep hilly regions to shallower hilly areas. In the lower reaches, the main river runs parallel to the eastern part of the Sichuan Basin, forming canyon extensions. The lower basin rises to mountainous terrain. Consequently, the middle and lower reaches of the JRB are characterized by frequent human activities, primarily cropland, leading to lower and patchy carbon storage distribution. In contrast, the topography in the middle and upper reaches of the JRB is dominated by mountainous terrain, including some plateau landforms. These areas feature higher elevations and lower temperatures and precipitation, resulting in a landscape dominated by forestland and grassland. The distribution of forestland and grassland is mosaic-like, which prevents the concentration of high carbon storage regions in a patchy manner. The marginal mountain region of the Sichuan Basin forms a strongly ascending fold belt with significant relative elevation differences. This region exhibits a clear transition from the hilly areas of the JRB, leading to a distinct boundary between high and low carbon storage value distributions.
Impact of land-use changes on carbon storage dynamics
From 2000 to 2020, the change in carbon storage caused by the conversion of cropland to other LUTs accounted for 71.70% of the total change in carbon storage in the JRB. The reduction in carbon storage due to the conversion of various LUTs to construction land was 1.72 times the total reduction in carbon storage in the JRB. Specifically, the reduction of carbon storage caused by the conversion of cropland to construction land was 1.45 times the total reduction in carbon storage in the JRB. Therefore, the conversion of cropland to construction land between 2000 and 2020 was the main factor driving the reduction in carbon storage in the JRB. This finding is consistent with the results of Ren et al. 63 on the impact of land-use change on carbon storage in Gansu Province. However, Zhang et al. 64 found that the conversion of cropland to other LUTs generally led to an increase in carbon storage. In the JRB, carbon storage decreased owing to the following two factors: (1) cropland area experienced a net loss, as 61.11% of the converted cropland area was transformed into construction land; (2) the total carbon density of construction land was only 45.45% of that of cropland.
Studies have yielded varying results regarding the impact of land-use changes on carbon storage under different scenarios. For instance, Li et al. 45 demonstrated that in the northeastern part of the Tibetan Plateau, carbon storage decreased over time from 2020 to 2030 under the BAU scenario, and the carbon storage increase in the EP scenario exceeded that of the CP scenario. In a study of Changchun City conducted by Li et al. 19 , carbon storage was projected to decrease over time from 2020 to 2030 under the BAU scenario, with less value impairment in the CP scenario compared with the BAU scenario, and an increase was observed under the EP scenario. Liu et al. 48 found that carbon storage increased over time from 2020 to 2035 under the BAU, CP, and EP scenarios in the Loess Plateau. In contrast, carbon storage in the JRB decreased under different scenarios, with the least value impairment occurring under the CP scenario and the most significant value impairment occurring under the BAU scenario. An examination of historical land-use changes in the JRB reveals that most of the newly added construction land originated from cropland, resulting in intense competition between these two land types. Construction land area increased substantially in different scenarios, while forestland and cropland with ecological functions decreased significantly. This directly leads to a decrease in carbon storage under different scenarios. The implementation of CP policies minimizes the encroachment of cropland and, consequently, reduces construction land expansion. Therefore, in the future, following the Chinese government’s requirements for replenishing cropland, the JRB should increase the cropland area through the reclamation and remediation of unused land suitable for cultivation and the construction of high-standard farmland. This will enhance the carbon sequestration function of the JRB ecosystem, thereby ensuring food and ecological security in the region and the realization of the “dual-carbon” goals.
Limitations and directions for future work
The three future scenarios for the JRB presented in this paper, established using Markov and PLUS models, may not comprehensively represent all potential future land-use scenarios for the region. Given that JRB encompasses various topographic and geomorphic zones, including plateaus, mountains, hills, and basins, there exist significant disparities in both natural environments and human geography. Therefore, future studies should consider dividing the JRB into distinct regions according to topography and geomorphology, allowing for more precise investigations of land-use changes and carbon storage estimations in each region. Additionally, the study identified 19 driving factors solely for simulating future scenarios, without analyzing in detail the driving forces behind land-use changes in the JRB. To comprehensively elucidate these factors, their impact on land-use changes should be further explored through methods such as geodetector models. Moreover, although this paper elucidates the changing patterns of land use in the JRB, it does not extensively explore the competitive relationships between various LUTs and the strategic decisions in the development and utilization of land resources. Therefore, future research should comprehensively analyze land-use conflicts within the JRB.
Conclusions
This paper explored the evolving dynamics of land use and carbon storage within the JRB between 2000 and 2020. Utilizing land-use data from 2020 as a foundation, a coupled PLUS–InVEST model was applied to simulate and predict land-use and carbon storage patterns for 2035 under varying scenarios. The study also investigated the ramifications of land-use alterations on carbon storage, resulting in the following key findings and principal conclusions:
The PLUS–InVEST coupled model demonstrated strong applicability within the JRB. Model validation yielded an OA of 0.9961, and an FoM coefficient of 0.0232, signifying a high level of simulation accuracy. These results demonstrate the PLUS–InVEST model effectiveness in forecasting future land-use patterns within the JRB.
Cropland was the predominant LUT in the JRB, encompassing over 43% of the total land area. It was primarily distributed in the middle and lower reaches of JRB, specifically within the hilly regions of the Sichuan Basin. Moreover, cropland was the only LUT that experienced a decrease in area; the decrease amounted to 1,673.27 km 2 , of which 61.11% was converted into construction land. This indicates the existence of a contradiction between human needs and available land resources in the JRB. This situation necessitates the scientific formulation of land-use policies in the JRB and calls for the exploration of new pathways for the coordinated development of regional urbanization and food and ecological security.
The three most substantial carbon reservoirs in the JRB—cropland, forestland, and grassland—collectively accounted for over 98% of the total carbon storage in 2000–2020, a sum which decreased over time. The conversion of cropland to construction land between 2000 and 2020 was the primary factor driving the reduction in carbon storage in the JRB. This resulted in an overall weakening of the carbon sequestration capacity of the ecosystem in the JRB. Carbon storage exhibits a clear spatial aggregation and stabilization within the JRB, with higher levels observed in the northern regions and lower levels in the southern areas. Potential strategies to address these trends and promote ecological security include implementing more afforestation and grass-planting initiatives in the middle and upper reaches of the JRB. Additionally, efforts to decelerate urbanization in the middle and lower reaches of the JRB could mitigate ecological risks.
Across different scenarios, there was a consistent pattern of increasing water and construction land areas, along with corresponding carbon storage expansion. Conversely, the areas and carbon storage of other LUTs decreased over time from 2020 to 2035, with these shifts predominantly occurring in the middle and lower reaches of the JRB. An examination of the period from 2020 to 2035 under the CP scenario revealed that cropland area exhibited a minimal decline of only 0.20%, significantly less than the 0.91% decrease in the BAU scenario and the 0.64% decrease in the EP scenario. Moreover, the CP-scenario carbon storage value impairment amounted to 2.45 × 10 6 t, which was 47.42% of the carbon storage value impairment in the BAU scenario and 65.56% of that in the EP scenario. Therefore, under the scenarios outlined in this paper, although the CP policy can effectively control the rate of cropland area reduction, it cannot prevent the reduction of cropland area, and the carbon sequestration function of the ecosystem in the JRB will still be weakened. Therefore, strict adherence to the task of replenishing cropland mandated by the Chinese government is imperative. Increasing cropland area through land remediation and high-standard farmland construction is crucial for enhancing the carbon sequestration function of the JRB ecosystem. This approach will positively contribute to ensuring the food and ecological security of the JRB and achieving the “dual-carbon” goals.
Data availability
All data presented in this study are available from the corresponding author on reasonable request.
Li, Y. G. et al. The role of land use change in affecting ecosystem services and the ecological security pattern of the Hexi Regions, Northwest China. Sci. Total Environ. 855 , 158940. https://doi.org/10.1016/j.scitotenv.2022.158940 (2023).
Article ADS CAS PubMed Google Scholar
Chen, L. T., Cai, H. S., Zhang, T., Zhang, X. L. & Zeng, H. Land use multi-scenario simulation analysis of Rao River Basin based on Markov-FLUS model. Acta Ecol. Sin. 42 , 3947–3958. https://doi.org/10.5846/stxb202106271705 (2022).
Article Google Scholar
Wang, Y. M., Zhang, Z. X. & Chen, X. Land use transitions and the associated impacts on carbon storage in the Poyang Lake Basin, China. Remote Sens. 15 , 2703. https://doi.org/10.3390/rs15112703 (2023).
Article ADS Google Scholar
Gong, W. F. et al. Assessing the impact of land use and changes in land cover related to carbon storage by linking trajectory analysis and InVEST models in the Nandu River Basin on Hainan Island in China. Front. Environ. Sci. 10 , 1038752. https://doi.org/10.3389/fenvs.2022.1038752 (2022).
Bian, Z. H. et al. Land use prediction based on CLUE-S model under different non-spatial simulation methods: A case study of the Qinhuai River Watershed. Sci. Geogr. Sin. 37 , 252–258. https://doi.org/10.13249/j.cnki.sgs.2017.02.011 (2017).
Wang, L. G. et al. Impacts of land-use change on the spatio-temporal patterns of terrestrial ecosystem carbon storage in the Gansu Province, Northwest China. Remote Sens. 14 , 3164. https://doi.org/10.3390/rs14133164 (2022).
Liang, Y. J., Hashimoto, S. & Liu, L. J. Integrated assessment of land-use/land-cover dynamics on carbon storage services in the Loess Plateau of China from 1995 to 2050. Ecol. Indic. 120 , 106939. https://doi.org/10.1016/j.ecolind.2020.106939 (2021).
Article CAS Google Scholar
Li, C. et al. Multi-scenario simulation of ecosystem service value for optimization of land use in the Sichuan-Yunnan ecological barrier, China. Ecol. Indic. 132 , 108328. https://doi.org/10.1016/j.ecolind.2021.108328 (2021).
Wang, Z. Y. et al. Dynamic simulation of land use change and assessment of carbon storage based on climate change scenarios at the city level: A case study of Bortala, China. Ecol. Indic. 134 , 108499. https://doi.org/10.1016/j.ecolind.2021.108499 (2022).
Hu, S. et al. Simulation of land use change and ecosystem service value dynamics under ecological constraints in Anhui Province, China. Int. J. Environ. Res. Public Health 17 , 4228. https://doi.org/10.3390/ijerph17124228 (2020).
Article PubMed PubMed Central Google Scholar
Liang, X. et al. Understanding the drivers of sustainable land expansion using a patch-generating land use simulation (PLUS) model: A case study in Wuhan, China. Comput. Environ. Urban Syst. 85 , 101569. https://doi.org/10.1016/j.compenvurbsys.2020.101569 (2021).
Liu, X. P. et al. A future land use simulation model (FLUS) for simulating multiple land use scenarios by coupling human and natural effects. Landsc. Urban Plan. 168 , 94–116. https://doi.org/10.1016/j.landurbplan.2017.09.019 (2017).
Wang, Y., Li, X. M., Zhang, Q., Li, J. F. & Zhou, X. W. Projections of future land use changes: Multiple scenarios-based impacts analysis on ecosystem services for Wuhan city, China. Ecol. Indic. 94 , 430–445. https://doi.org/10.1016/j.ecolind.2018.06.047 (2018).
Deng, Z. W., Quan, B., Zhang, H. B., Xie, H. Q. & Zhou, Z. Scenario simulation of land use and cover under safeguarding ecological security: A case study of Chang-Zhu-Tan metropolitan area, China. Forests 14 , 2131. https://doi.org/10.3390/f14112131 (2023).
Wang, M. M., Jiang, Z. Z., Li, T. B., Yang, Y. C. & Jia, Z. Analysis on absolute conflict and relative conflict of land use in Xining metropolitan area under different scenarios in 2030 by PLUS and PFCI. Cities 137 , 104314. https://doi.org/10.1016/j.cities.2023.104314 (2023).
Li, X., Liu, Z. S., Li, S. J. & Li, Y. X. Multi-scenario simulation analysis of land use impacts on habitat quality in Tianjin based on the PLUS model coupled with the InVEST model. Sustainability 14 , 6923. https://doi.org/10.3390/su14116923 (2022).
Wei, Q. Q. et al. Temporal and spatial variation analysis of habitat quality on the PLUS-InVEST model for Ebinur Lake Basin, China. Ecol. Indic. 145 , 109632. https://doi.org/10.1016/j.ecolind.2022.109632 (2022).
Nie, W. B. et al. Simulating future land use by coupling ecological security patterns and multiple scenarios. Sci. Total Environ. 859 , 160262. https://doi.org/10.1016/j.scitotenv.2022.160262 (2023).
Article CAS PubMed Google Scholar
Li, Y. X., Liu, Z. S., Li, S. J. & Li, X. Multi-scenario simulation analysis of land use and carbon storage changes in Changchun city based on FLUS and InVEST model. Land 11 , 647. https://doi.org/10.3390/land11050647 (2022).
Wang, Z., Zeng, J. & Chen, W. X. Impact of urban expansion on carbon storage under multi-scenario simulations in Wuhan, China. Environ. Sci. Pollut. Res. 29 , 45507–45526. https://doi.org/10.1007/s11356-022-19146-6 (2022).
Zhang, S. H., Liu, Y. & Wang, T. W. How land use change contributes to reducing soil erosion in the Jialing River Basin, China. Agric. Water Manag. 133 , 65–73. https://doi.org/10.1016/j.agwat.2013.10.016 (2014).
Hou, X. N., Xu, Z., Tang, C. H. & Zhang, S. H. Spatial distributions of nitrogen and phosphorus losses in a basin and responses to best management practices—Jialing River Basin case study. Agric. Water Manag. 255 , 107048. https://doi.org/10.1016/j.agwat.2021.107048 (2021).
Xu, F. et al. Nonpoint Source Pollution (NPSP) Induces structural and functional variation in the fungal community of sediments in the Jialing River, China. Microb. Ecol. 85 , 1308–1322. https://doi.org/10.1007/s00248-022-02009-5 (2023).
Guo, W. X., Jiao, X. Y., Zhou, H. T., Zhu, Y. W. & Wang, H. X. Hydrologic regime alteration and influence factors in the Jialing River of the Yangtze River, China. Sci. Rep. 12 , 11166. https://doi.org/10.1038/s41598-022-15127-4 (2022).
Article ADS CAS PubMed PubMed Central Google Scholar
Hou, X. N., Zhang, S. H., Ruan, Q. Y. & Tang, C. H. Synergetic impact of climate and vegetation cover on runoff, sediment, and nitrogen and phosphorus losses in the Jialing River Basin, China. J. Clean Prod. 361 , 132141. https://doi.org/10.1016/j.jclepro.2022.132141 (2022).
Qin, Q. et al. Length–weight relationships and diversity status of fishes in the midstream of the Jialing River, a tributary of the upper Yangtze River, China. Diversity 15 , 561. https://doi.org/10.3390/d15040561 (2023).
Wu, L., Long, T. Y., Liu, X. & Guo, J. S. Impacts of climate and land-use changes on the migration of non-point source nitrogen and phosphorus during rainfall-runoff in the Jialing River Watershed, China. J. Hydrol. 475 , 26–41. https://doi.org/10.1016/j.jhydrol.2012.08.022 (2012).
Article ADS CAS Google Scholar
Zeng, X. F., Zhao, N., Sun, H. W., Ye, L. & Zhai, J. Q. Changes and relationships of climatic and hydrological droughts in the Jialing River Basin, China. PLoS ONE 10 , e0141648. https://doi.org/10.1371/journal.pone.0141648 (2015).
Article CAS PubMed PubMed Central Google Scholar
Zhang, J., Zhang, M., Song, Y. Y. & Lai, Y. Q. Hydrological simulation of the Jialing River Basin using the MIKE SHE model in changing climate. J. Water Clim. Change 12 , 2495–2514. https://doi.org/10.2166/wcc.2021.253 (2021).
Zhang, T., Zhang, X. N., Xia, D. Z. & Liu, Y. Y. An analysis of land use change dynamics and its impacts on hydrological processes in the Jialing River Basin. Water 6 , 3758–3782. https://doi.org/10.3390/w6123758 (2014).
Wang, J. B., Wu, Y. F. & Gou, A. P. Habitat quality evolution characteristics and multi-scenario prediction in Shenzhen based on PLUS and InVEST models. Front. Environ. Sci. 11 , 210. https://doi.org/10.3389/fenvs.2023.1146347 (2023).
Li, Y. H. et al. Spatial-temporal evolution and prediction of carbon storage: An integrated framework based on the MOP–PLUS–InVEST model and an applied case study in Hangzhou, East China. Land 11 , 2213. https://doi.org/10.3390/land11122213 (2022).
Li, Y. M. et al. Spatio-temporal evolution and prediction of carbon storage in Kunming based on PLUS and InVEST models. PeerJ 11 , e15285. https://doi.org/10.7717/peerj.15285 (2023).
Zhang, P. et al. Spatial and temporal distribution characteristics of carbon storage in Handan City based on PLUS and InVEST models. Bull. Soil Water Conserv. 43 , 338–348. https://doi.org/10.13961/j.cnki.stbctb.20230111.001 (2023).
Wang, C. Y. et al. Land use change and its impact on carbon storage in northwest China based on FLUS-Invest: A case study of Hu-Bao-Er-Yu urban agglomeration. Ecol. Environ. Sci. 31 , 1667–1679. https://doi.org/10.16258/j.cnki.1674-5906.2022.08.019 (2022).
Xiang, S. J. et al. Response and vulnerability analysis of carbon storage to LUCC in the main urban area of Chongqing during 2000–2020. J. Nat. Resour. 37 , 1198–1213. https://doi.org/10.31497/zrzyxb.20220507 (2022).
Xu, L., He, N. P. & Yu, G. R. A dataset of carbon density in Chinese terrestrial ecosystems (2010s). Chin. Sci. Data 4 , 90–96. https://doi.org/10.11922/csdata.2018.0026.zh (2019).
Xia, N. The Research on Carbon Storage of 5 Kinds of major forest types in Sichuan Basin hilly region (Sichuan Agricultural University, 2014).
Google Scholar
Xia, M. et al. Carbon stock and its value for 3 types of wetland ecosystems on Zoige Plateau, Sichuan Province. J. Fujian Agric. For. Univ. (Nat. Sci. Ed.) 49 , 392–398. https://doi.org/10.13323/j.cnki.j.fafu(nat.sci.).2020.03.017 (2020).
Zhang, P. P. et al. Spatio-temporal variation and dynamic simulation of ecosystem carbon storage in the north-south transitional zone of China. J. Nat. Resour. 37 , 1183–1197. https://doi.org/10.31497/zrzyxb.20220506 (2022).
Li, X. Y. et al. Spatio-temporal patterns of carbon storage derived using the InVEST model in Heilongjiang Province, Northeast China. Front. Earth Sci. 10 , 846456. https://doi.org/10.3389/feart.2022.846456 (2022).
Liu, X. J., Li, X., Liang, X., Shi, H. & Ou, J. P. Simulating the change of terrestrial carbon storage in China based on the FLUS-InVEST model. Trop. Geogr. 39 , 397–409. https://doi.org/10.13284/j.cnki.rddl.003138 (2019).
Yang, L. W., Zhao, J., Zhu, J. T., Liu, L. & Zhang, P. Spatial-temporal change and prediction of carbon stock in the ecosystem of Xi’an based on PLUS and InVEST models. Remote Sens. Nat. Resour. 34 , 175–182. https://doi.org/10.6046/zrzyyg.2021348 (2022).
Wang, R. Y., Cai, H. N., Chen, L. K. & Li, T. H. Spatiotemporal evolution and multi-scenario prediction of carbon storage in the GBA based on PLUS–InVEST models. Sustainability 15 , 8421. https://doi.org/10.3390/su15108421 (2023).
Li, J. Y., Gong, J., Guldmann, J. M., Li, S. C. & Zhu, J. Carbon dynamics in the northeastern Qinghai-Tibetan Plateau from 1990 to 2030 using Landsat land use/cover change data. Remote Sens. 12 , 528. https://doi.org/10.3390/rs12030528 (2020).
Wang, W., Zhu, J. H., Liu, W. L. & Liu, M. in 2009 Second International Conference on Intelligent Computation Technology and Automation. 27–30 (IEEE).
Chen, J. et al. Spatial–temporal evolution and prediction of carbon storage in areas rich in ancient remains: A case study of the Zhouyuan Region, China. Land 12 , 1266. https://doi.org/10.3390/land12061266 (2023).
Liu, K., Zhang, C. Z., Zhang, H., Xu, H. & Xia, W. Spatiotemporal variation and dynamic simulation of ecosystem carbon storage in the Loess Plateau Based on PLUS and InVEST models. Land 12 , 1065. https://doi.org/10.3390/land12051065 (2023).
He, Y. L., Ma, J. M., Zhang, C. S. & Yang, H. Spatio-temporal evolution and prediction of carbon storage in Guilin based on FLUS and InVEST models. Remote Sens. 15 , 1445. https://doi.org/10.3390/rs15051445 (2023).
Wang, C. Y. et al. Plus-InVEST study of the Chengdu-Chongqing urban agglomeration’s land-use change and carbon storage. Land 11 , 1617. https://doi.org/10.3390/land11101617 (2022).
Gou, M. M. et al. Spatiotemporal variations and scenario simulation of habitat quality in a typical basin of the Three Gorges Reservoir Area. Chin. J. Ecol. 42 , 180–189. https://doi.org/10.13292/j.1000-4890.202301.013 (2023).
Varga, O. G., Pontius, R. G. Jr., Singh, S. K. & Szabó, S. Intensity analysis and the figure of Merit’s components for assessment of a Cellular Automata–Markov simulation model. Ecol. Indic. 101 , 933–942. https://doi.org/10.1016/j.ecolind.2019.01.057 (2019).
Zhu, G. F. et al. Land-use changes lead to a decrease in carbon storage in arid region, China. Ecol. Indic. 127 , 107770. https://doi.org/10.1016/j.ecolind.2021.107770 (2021).
Wang, R. Y. et al. Coupling PLUS–InVEST model for ecosystem service research in Yunnan Province, China. Sustainability 15 , 271. https://doi.org/10.3390/su15010271 (2022).
Zhao, J. et al. Ecosystem services assessment based on land use simulation: A case study in the Heihe River Basin, China. Ecol. Indic. 143 , 109402. https://doi.org/10.1016/j.ecolind.2022.109402 (2022).
Lin, Z. et al. Spatial analysis of carbon storage density of mid-subtropical forests using geostatistics: A case study in Jiangle County, southeast China. Acta Geochim. 37 , 90–101. https://doi.org/10.1007/s11631-017-0160-8 (2018).
Li, X. & Zhang, P. Patterns and influencing factors of express outlets in China. Sustainability 14 , 8061. https://doi.org/10.3390/su14138061 (2022).
Xiao, D. Y., Niu, H. P., Yan, H. X., Fan, L. X. & Zhao, S. X. Spatiotemperal evolution of land use pattern in the Yellow River Basin (Henan section) from 1990 to 2018. Trans. Chin. Soc. Agric. Eng. 36 , 271–281. https://doi.org/10.11975/j.issn.1002-6819.2020.15.033 (2020).
Wang, C. W., Luo, J. J., Qing, F., Tang, Y. & Wang, Y. F. Analysis of the driving force of spatial and temporal differentiation of carbon storage in Taihang Mountains based on InVEST model. Appl. Sci. 12 , 10662. https://doi.org/10.3390/app122010662 (2022).
Chen, D. R. et al. Analysis of evolution of carbon stock and its vulnerability characteristics based on land use change in Guizhou Province. Bull. Soil Water Conserv. 43 , 1–9. https://doi.org/10.13961/j.cnki.stbctb.20230216.002 (2023).
Lin, T. et al. Spatial correlation and prediction of land use carbon storage based on the InVEST-PLUS model: A case study in Guangdong Province. Chin. Environ. Sci. 42 , 4827–4839. https://doi.org/10.19674/j.cnki.issn1000-6923.2022.0172 (2022).
Li, Y. J., Ye, C. S. & Huang, X. L. Temporal–spatial evolution and scenario simulation of production-living-ecological space in Nanchang based on CLUE-S model. Res. Soil Water Conserv. 28 , 325–332. https://doi.org/10.13869/j.cnki.rswc.2021.05.037 (2021).
Ren, X. J., Pei, T. T., Chen, Y., Xie, B. P. & Cheng, D. L. Impact of land use change on carbon storage in Gansu Province based on carbon density correction. Ecol. Sci. 40 , 66–74. https://doi.org/10.14108/j.cnki.1008-8873.2021.04.008 (2021).
Zhang, M. et al. Impact of land use type conversion on carbon storage in terrestrial ecosystems of China: A spatial–temporal perspective. Sci. Rep. 5 , 10233. https://doi.org/10.1038/srep10233 (2015).
Download references
Acknowledgements
This work was supported by the Nanchong Vocational College of Culture and Tourism of Research Fund Program (Grant No. NC23B042). We would like to thank the editors and the anonymous reviewers for their constructive comments and suggestions to improve our manuscript.
Author information
Authors and affiliations.
Publicity and United Front Work Department, Nanchong Vocational College of Culture and Tourism, Nanchong, 637400, China
Hotel Department, Nanchong Vocational College of Culture and Tourism, Nanchong, 637400, China
Liqin Li & Mili Sun
CAS Key Laboratory of Mountain Ecological Restoration and Bioresource Utilization and Ecological Restoration Biodiversity Conservation Key Laboratory of Sichuan Province, Chengdu Institute of Biology, Chinese Academy of Sciences, Chengdu, 610041, China
Renhuan Zhu
University of Chinese Academy of Sciences, Beijing, 100049, China
College-Locality Cooperation and Training Center, Nanchong Vocational College of Culture and Tourism, Nanchong, 637400, China
Department of Logistics, Nanchong Vocational College of Culture and Tourism, Nanchong, 637400, China
Department of General Education, Nanchong Vocational College of Culture and Tourism, Nanchong, 637400, China
Benchuan Xu
You can also search for this author in PubMed Google Scholar
Contributions
Conceptualization, S.Y. and R.Z.; methodology, S.Y. and R.Z.; software, S.Y., C.L. and X.L.; validation, S.Y., L.L. and R.Z.; formal analysis, S.Y., L.L., R.Z., C.L. and X.L.; investigation, S.Y., L.L., R.Z. and C.L.; resources, S.Y., L.L., R.Z., C.L. and X.L.; data curation, S.Y., L.L., R.Z. and X.L.; writing—original draft preparation, S.Y., R.Z. and M.S.; writing—review and editing, S.Y., L.L., R.Z., C.L., X.L., M.S. and B.X.; visualization, S.Y., R.Z., C.L. and X.L.; supervision, S.Y. and R.Z.; project administration, S.Y., L.L. and R.Z.; funding acquisition, L.L. All authors reviewed the manuscript.
Corresponding author
Correspondence to Renhuan Zhu .
Ethics declarations
Competing interests.
The authors declare no competing interests.
Additional information
Publisher's note.
Springer Nature remains neutral with regard to jurisdictional claims in published maps and institutional affiliations.
Rights and permissions
Open Access This article is licensed under a Creative Commons Attribution 4.0 International License, which permits use, sharing, adaptation, distribution and reproduction in any medium or format, as long as you give appropriate credit to the original author(s) and the source, provide a link to the Creative Commons licence, and indicate if changes were made. The images or other third party material in this article are included in the article's Creative Commons licence, unless indicated otherwise in a credit line to the material. If material is not included in the article's Creative Commons licence and your intended use is not permitted by statutory regulation or exceeds the permitted use, you will need to obtain permission directly from the copyright holder. To view a copy of this licence, visit http://creativecommons.org/licenses/by/4.0/ .
Reprints and permissions
About this article
Cite this article.
Yang, S., Li, L., Zhu, R. et al. Assessing land-use changes and carbon storage: a case study of the Jialing River Basin, China. Sci Rep 14 , 15984 (2024). https://doi.org/10.1038/s41598-024-66742-2
Download citation
Received : 19 February 2024
Accepted : 03 July 2024
Published : 10 July 2024
DOI : https://doi.org/10.1038/s41598-024-66742-2
Share this article
Anyone you share the following link with will be able to read this content:
Sorry, a shareable link is not currently available for this article.
Provided by the Springer Nature SharedIt content-sharing initiative
- Land-use change
- Jialing River Basin
By submitting a comment you agree to abide by our Terms and Community Guidelines . If you find something abusive or that does not comply with our terms or guidelines please flag it as inappropriate.
Quick links
- Explore articles by subject
- Guide to authors
- Editorial policies
Sign up for the Nature Briefing: Anthropocene newsletter — what matters in anthropocene research, free to your inbox weekly.

- Moneycontrol Trending Stock
- Infosys INE009A01021, INFY, 500209
- State Bank of India INE062A01020, SBIN, 500112
- Yes Bank INE528G01027, YESBANK, 532648
- Bank Nifty
- Nifty 500
- Mutual Funds
- Commodities
- Futures & Options
- Cryptocurrency
- My Portfolio
- My Watchlist
- FREE Credit Score ₹100 Cash Reward
- My Messages
- Price Alerts
- Chat with Us
- Download App
Follow us on:
Airbnb says 30% rise in bookings from Indian guests for Olympic Games Paris 2024
Beyond paris, indian travellers are also exploring other locations in france such as nice, aubervilliers, colombes, and saint-ouen-sur-seine, airbnb said in a statement..
 and Chateauroux (shooting events), along with cities hosting football matches like Saint-Etienne, Lyon, Nantes, Nice, and Bordeaux, are experiencing significant interest, it added. (Representative Image)")
key Olympic venues like Colombes (field hockey) and Chateauroux (shooting events), along with cities hosting football matches like Saint-Etienne, Lyon, Nantes, Nice, and Bordeaux, are experiencing significant interest, it added. (Representative Image)
Trending news.

- Samsung's reaction to Apple's first store in Malaysia is viral: 'The war got real'
- Kolkata man used to 'open-air sauna' weather on visiting Bengaluru: 'Almost as pleasant as AC'
- Harbhajan Singh issues apology post backlash for viral 'Tauba Tauba' reel with Yuvraj Singh, Suresh Raina
- This 'premium room' in Delhi is for Rs 10,000 per month. UPSC aspirant shares pic
You got 30 Day’s Trial of

- Ad-Free Experience

- Actionable Insights
- MC Research
- Economic Calendar

You are already a Moneycontrol Pro user.
* We collect cookies for the functioning of our website and to give you the best experience. This includes some essential cookies.
Cookies from third parties which may be used for personalization and determining your location. By clicking 'I Accept', you agree to the usage of cookies to enhance your personalized experience on our site. For more details you can refer to our cookie policy
* I agree to the updated privacy policy and I warrant that I am above 16 years of age
I agree to the processing of my personal data for the purpose of personalised recommendations on financial and similar products offered by MoneyControl
I agree personalized advertisements and any kind of remarketing/retargeting on other third party websites
I agree to receive direct marketing communications via Emails and SMS
Please select (*) all mandatory conditions to continue.
- Case study: An overview of Quzhou's effort to promote Southern Confucian culture
- Guided by Xi Jinping Thought on Culture, Quzhou has focused on preserving and promoting traditional Chinese culture in recent years. Keeping up with global cultural developments, Quzhou has actively looked into modern relevance of Confucian culture. The city has strengthened international cooperation with organizations such as the International Confucian Association, Confucius Institutes, and universities in China. Through comprehensive international exchanges with a diverse range of organizations and fields, Quzhou has built a bridge between the Southern Confucian culture and other cultures from around the world, consistently enhancing its global reputation.
1. Foster cultural exchange and mutual learning to promote Southern Confucian culture
Committed to telling China's stories and spreading China's voices, Quzhou has incorporated the Southern Confucian culture into the global cultural tapestry. In 2023, the city hosted over 20 international exchange events, with more than 500 international students and scholars participating, in a move to promote the Southern Confucian culture and foster mutual understanding. The city also collaborated with the Nishan World Center for Confucian Studies and Qufu in Shandong to hold events like joint ancestral worship ceremonies, as part of a strategic cooperation initiative to integrate Southern Confucianism and Northern Confucianism.
Leveraging its geographical advantage at the intersection of Zhejiang, Jiangxi, Anhui, and Fujian provinces, Quzhou has established an academy and an alliance to promote cultural exchange among Min Studies, Xin Studies, Wu Studies, and Hui Studies, thereby broadening its cultural exchange network. The city has proactively formed cooperative relationships with the Center for Language Education and Cooperation, the China Confucius Foundation, and other organizations. At the Global Chinese Plus Conference, Quzhou signed a framework agreement on international Chinese language education and Chinese culture promotion to actively integrate into the global cultural landscape.
2. Explore diverse channels to promote Southern Confucian culture
Quzhou has explored new stories, narratives and ecosystems to promote the Southern Confucian culture. Through promotional films and short videos like "Southern Confucianism," "A Glimpse into Quzhou's Intangible Cultural Heritage," and "The Grand Memorial Ceremony for Confucius," Quzhou has presented the Southern Confucian culture to a global audience spanning over 100 countries, including the U.S., the U.K., and Canada. These productions have captured attention from media outlets in countries along the Belt and Road route, such as Thailand's Siam Rath, Serbia's Politika, and Egypt's Al-Akhbar.
Quzhou has initiated the event "The Great Sage: Online Exhibition of Portraits of Confucius," inviting people to submit Confucius-related images from across the globe. To date, the collection has amassed over 3,000 submissions, including ancient texts, artworks, and sculptures provided by institutions and individuals. Additionally, Quzhou has introduced "Grandpa Nankong," a cartoon character symbolizing Quzhou, which was featured on the Mega Screen at the Times Square Plaza in New York.
3. Preserve and pass on Southern Confucian culture
Quzhou has launched the Southern Confucian Cultural Gene Decoding Project, which involves a database of 2,000 cultural elements, categorizing 154 aspects of the Southern Confucian culture, and analyzing 20 key cultural elements. This provides a solid foundation for further study and research into the Southern Confucian culture.
A joint research project with the International Confucian Association, titled "Research on the Inheritance and Development of the Southern Confucian Lineage and its Culture," has been approved and funded by the National Social Science Foundation of China. This marks a significant step forward in the research of the Southern Confucian culture.
Quzhou has systematically reviewed 69 high-level research findings, including scholarly books and papers, to strengthen the foundation of the Southern Confucian culture and prop up academic research and educational efforts. A series study on the inheritance and development of the Southern Confucian culture is now part of Zhejiang's cultural research program.
To present the Southern Confucian culture in innovative ways, Quzhou has infused local characteristics and cultural resources into various art forms, including the musical "The Southern Confucianism," the themed live-action performance "Dongnan Queli," the immersive performance "Dream of Shuitingmen," along with Confucius memorial ceremonies, classical Chinese etiquette, and the Six Arts. The memorial ceremony for Confucius held at the Quzhou Confucius Ancestral Temple is among the first to been recognized an international cultural exchange program in Zhejiang province.
Go to Forum >> 0 Comment(s)
Add your comments....
- User Name Required
- Your Comment
- Work & Careers
- Life & Arts
The European country playing off the US, Russia, China and Europe
Try unlimited access only $1 for 4 weeks.
Then $75 per month. Complete digital access to quality FT journalism on any device. Cancel anytime during your trial.
- Global news & analysis
- Expert opinion
- Special features
- FirstFT newsletter
- Videos & Podcasts
- Android & iOS app
- FT Edit app
- 10 gift articles per month
Explore more offers.
Standard digital.
- FT Digital Edition
Premium Digital
Print + premium digital, ft professional, weekend print + standard digital, weekend print + premium digital.
Essential digital access to quality FT journalism on any device. Pay a year upfront and save 20%.
- Global news & analysis
- Exclusive FT analysis
- FT App on Android & iOS
- FirstFT: the day's biggest stories
- 20+ curated newsletters
- Follow topics & set alerts with myFT
- FT Videos & Podcasts
- 20 monthly gift articles to share
- Lex: FT's flagship investment column
- 15+ Premium newsletters by leading experts
- FT Digital Edition: our digitised print edition
- Weekday Print Edition
- Videos & Podcasts
- Premium newsletters
- 10 additional gift articles per month
- FT Weekend Print delivery
- Everything in Standard Digital
- Everything in Premium Digital
Complete digital access to quality FT journalism with expert analysis from industry leaders. Pay a year upfront and save 20%.
- 10 monthly gift articles to share
- Everything in Print
- Make and share highlights
- FT Workspace
- Markets data widget
- Subscription Manager
- Workflow integrations
- Occasional readers go free
- Volume discount
Terms & Conditions apply
Explore our full range of subscriptions.
Why the ft.
See why over a million readers pay to read the Financial Times.
IMAGES
VIDEO
COMMENTS
The top ten providers in China before COVID-19 were: Airbnb, Tujia, Xiaozhu, Mayi, Muniao, Youtianxia, Meituan, Onehome, Zizaike, and Locals (CNPP, 2020). Arguably the most successful Chinese platform provider is Tujia. Tujia was founded in 2011 and then it absorbed Mayi (Sina.com, 2016).
Challenges Faced by Airbnb in China. Airbnb in China struggled with strong competition from domestic players, cultural differences that led to trust issues, and regulatory restrictions and legal challenges. Strong competition from domestic players. Local big names like Tujia and Xiaozhu were giving Airbnb a run for its money in the domestic ...
In 2015, Airbnb, Inc. began to explore entry into the Chinese market. In August of that year, it announced a partnership with two of its China-based investors to help it navigate the expansion. By January 2016, the company was facing a number of fundamental questions. First, how should it best position itself in China to ensure a successful expansion? Should it work with a local competitor and ...
Compared with Airbnb's direct competitors in China, Xiaozhu and Tujia, Airbnb's operating model and skills lack more localized services and the ability to adapt to the Chinese market. The impact of cultural and social factors on a consumer's involvement in the sharing economy is examined in Lee et al.'s paper.
5 Conclusion. Airbnb is an example of the booming sharing economy happening around the world, including China. It offered customers to book homestay hotels online. Our findings indicate that it begins to influence Chinese tourism, bringing some changes to this industry in the country.
With China's tourism disrupted by intermittent lockdowns since 2020 "with no end in sight," Airbnb decided to it was time to end the business. "The domestic segment is costly and complex ...
This paper explores whether the spatial distribution of Airbnb in China's rapid urbanization process exhibits characteristics, paths, and drivers that are different from those of cities in other countries. ... Cocola-Gant A.; Gago A. Airbnb, buy-to-let investment and tourism-driven displacement: A case study in Lisbon. Environment and ...
For Airbnb Listings, China is the next major market. But how has Airbnb in China changed during the pandemic — and what's next for China market trends? Visit! ... Blog Latest Press & News AirDNA Research Webinar & Videos Case Studies Guides. Back To Blogs. Airbnb China: Tracking Short-Term Rentals' Rebound. February 23, 2021. Copy link.
Through the lens of the expanded Experience Economy Model, and based on 7606 customer comments for 294 listed Airbnb accommodations in Hangzhou, China, this study explored eight aspects of customer experience—namely, entertainment, education, esthetics, escapism, interaction, home-feeling, tangible-sensorial and localness—regarding Airbnb ...
Abstract. In 2015, Airbnb, Inc began to explore entry into the Chinese market. In August of that year, it announced a partnership with two of its China-based investors to help it navigate the expansion. By January 2016, the company was facing a number of fundamental questions. First, how should it best position itself in China to ensure a ...
The biggest struggle that Airbnb's business model had failed to account for were the cultural barriers set by Chinese traditions. With China's rapid urbanization in the 21th century, Airbnb had expected the Chinese consumers to be in support of the sharing economy, as it would help address the sudden rise in demand for housing.
As part of its retreat, Airbnb will remove roughly 150,000 listings in China, out of six million around the world. Stays in the country have accounted for roughly 1 percent of Airbnb's business ...
Purpose This study aims to provide insights into Airbnb's exit from the China market, specifically from the perspective of platform competition. Design/methodology/approach Based on the understanding of the evolution and competition of peer-to-peer (P2P) accommodation market in China and the double-edged network effects, this viewpoint article provides an in-depth discussion on Airbnb's ...
Sara Naderi Koupaei. A large share of growth in the sharing or platform economy is driven by peer-to-peer (P2P) accommodation providers such as Airbnb. The literature argues for both positive and negative socio-cultural, economic and environmental impacts emanating from the tourism and hospitality businesses and value chains that are dependent ...
Airbnb Officially Enters China. Upon entry to the Chinese market, foreign businesses often face stiff competition from their Chinese counterparts. Airbnb is. ... strategies are worth following though as it could provide insights into the effective means to successfully enter China's markets. Case Study: Usability Testing in China ...
The homestay model represented by Airbnb has developed rapidly in China over the last several years. By taking the city of Suzhou in China as a case study, this paper analyzes the distribution characteristics and impact factors of Airbnb in a typical historical and cultural tourism city and discusses the uniqueness of Suzhou.
A sharing economy is developing rapidly worldwide, especially in China. Trust has been considered as a crucial factor in facilitating the practice of the short-term rental business, where hosts and renters are strangers. However, not only has the inherent trust-building mechanism of this newly emerged business model not been fully explored, but how cultural values affect the trust-building ...
Airbnb is moving out of China. Starting July 30, the U.S. online rental marketplace will shut down all its listings and experiences on the Chinese mainland but will keep operating its outbound travel business. The company said the decision was made "in the face of the challenges of the pandemic." However, during the same period, Airbnb's local ...
This study is based on 45 hoteliers and industry professionals in China, who share their views on Airbnb development and how it should move forward. The findings of this study shed light on the informal accommodation service and its future directions in China. 爱彼迎在中国的未来:酒店业领导者的行业观点.
Airbnb is a model for the global sharing economy, but it is increasingly influenced by other functions and facilities in cities as it grows. In this paper, the zero-expansion negative binomial regression was used to study the factors affecting the spatial distribution of Airbnb in Nanjing, China.
For more:https://news.cgtn.com/news/2022-07-05/Tech-Please-Why-did-Airbnb-fail-in-China--1bqkJHSzxq8/index.htmlAirbnb is moving out of China.Starting July 3...
View Case Study 1 - AirBnB in China (2).pptx from ADVANCE AI PAS3153 at University of Selangor, Shah Alam. GCM 6223 Marketing Management Case Study 1: AirBnB in China Ahmed Zaki Bin Abdul Rashid
Airbnb History Airbnb is a peer-to-peer online marketplace that enables people to list, discover, and book accommodations and lodging options worldwide. The company was founded in 2008 by Brian Chesky, Joe Gebbia, and Nathan Blecharczyk in San Francisco, California. The idea for Airbnb came about when the founders were struggling to pay their rent and decided to rent space in their apartment ...
China is leading the world in adopting generative AI, a new survey shows, the latest sign the country is making strides in the technology that gained global attention after U.S.-based OpenAI's ...
Wang, Z. Y. et al. Dynamic simulation of land use change and assessment of carbon storage based on climate change scenarios at the city level: A case study of Bortala, China. Ecol. Indic. 134, 108499.
For years, Airbnb has known some of its hosts have used hidden cameras to secretly spy on guests, invading their most private and intimate moments. While Airbnb has repeatedly acknowledged the ...
Beyond Paris, Indian travellers are also exploring other locations in France such as Nice, Aubervilliers, Colombes, and Saint-Ouen-sur-Seine, Airbnb said in a statement.
You are here: China > Nation > Case study: An overview of Quzhou's effort to promote Southern Confucian culture 0 Comment(s) Print E-mail China.org.cn, July 10, 2024
Barcelona and the Airbnb backlash; Pål Enger, Norwegian art thief, 1967-2024 ... The deal is a case study in how a small non-aligned state can prepare for Trump's possible return to the White ...
The study draws on data from life history interviews conducted with 20 long-time LGBT activists in Yunnan, China. The findings indicate that their sexual orientation and gender identities were, in the long run, seen as assets by the activists that shaped their work and commitment in the LGBT movement.