- presentation

Create Presentation from Jupyter Notebook

You don't need to install any additional framework to make a presentation from Jupyter Notebook. Jupyter is using Reveal.js library for creating slides. However, I strongly recommend to install RISE ( R eveal.js I Python S lideshow E xtension) extension. It greatly simplifies the process of slide creation with a live preview.
The outline for this article:
- create a simple notebook with one chart,
- convert notebook to a slideshow,
- presentation development with RISE extension,
- parameterized presentations,
- publishing presentation.
Create Jupyter Notebook
Let's create a Jupyter notebook. It will have a few Markdown and Python cells.

Please notice that we can mix Python variables with Markdown thanks to IPython.display.Markdown() function:
The output of the above code cell will contain a Markdown. There is a simple scatter plot in the notebook for randomly generated points:
The matplotlib scatter plot:

It is a simple notebook created for example purposes. There is no limit on the number of slides or cells. From my experience, I was creating a presentation with more than 70 slides with many plots/images, and the slideshow was working smoothly, even with the presentation published as a website (hosted in the cloud).
Create Presentation
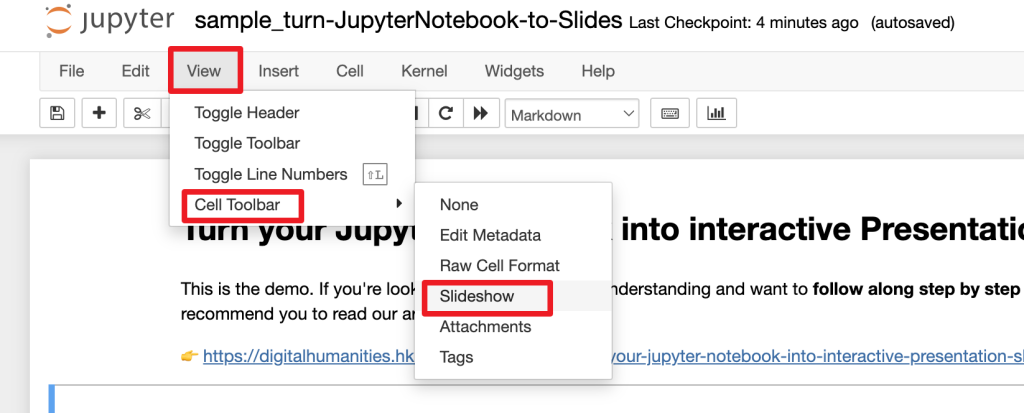
The notebook is saved in ipynb format . The next step is to convert it to a slideshow. We need to provide information on how to use cells in the presentation. Please click View ➡️ Cell Toolbar ➡️ Slideshow .

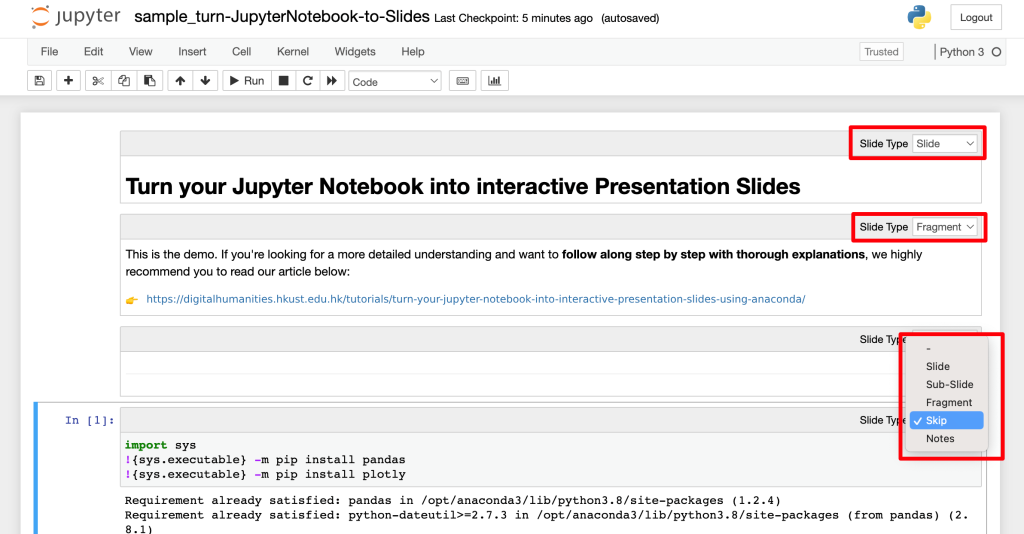
Each cell will have a toolbar with the select widget. You can select there how cells will be used in the presentation:
- Slide - the cell will be a new slide;
- Sub-Slide - the cell will be shown in the current slide as a replacement for previous content. It will be available in arrow-down navigation;
- Fragment - the cell will appear in the current slide, it will append to the previous content. It will be available in arrow-down and arrow-right navigation;
- Skip - the content will not be displayed in the presentation;
- Notes - notes for slide, the cell content is not displayed in the presentation;
Please select the Slide Type for every cell and save the notebook.

How to create a presentation for Jupyter Notebook? We need to use the nbconvert tool. It is installed with Jupyter Notebook. There is a command for converting notebook to presentation:
You can open the output file presentation.slides.html in the web browser (just double-click on the file). Alternatively, you can serve slides with jupyter ; slides will be available at http://127.0.0.1:8000/presentation.slides.html :
There are several ways to hide the code in the presentation, one of them is to pass --no-input parameter to nbconvert :
The presentation with hidden code:
It is possible to convert the Jupyter Notebook presentation into PDF slides. One of the ways to do this is to add ?print-pdf in the URL in a web browser while displaying HTML format:
The presentation will be in a format ready to print. To save it as a PDF, just print the website with Save as PDF selected for the destination.

RISE Extension
There is a RISE extension that may be helpful for developing presentations in Jupyter Notebook. It can be easily installed with pip or conda :
You get a small chart icon in the top toolbar after installation. You switch between the notebook and presentation views by clicking on the chart icon.
What is more, you can edit the code in presentation mode. The RISE extension doesn't have the option to hide the code ( GitHub issue discussion about hiding code feature in RISE repository ). If you would like to hide/show the code during the presentation development, you need to install an additional extension called hide_code .
Parameterized Presentation
What if you would like to change or recompute charts in the presentation based on user input? There is an open-source framework called Mercury that makes it possible.
You can easily add interactive widgets to the presentation and publish it with Mercury . Widgets are added based on the YAML header. They are directly connected with Python variables in the notebook. User changes, tweak widgets, and execute the notebook with new values. The slides in the presentation will be automatically recomputed.
The video from an interactive presentation about Mercury :
Publishing Presentation
The final presentation is in HTML format. You can publish it as a static website. There are several ways to publish Jupyter Notebook; you can host it on GitHub Pages, Netlify, or Vercel. If you are using Mercury framework for parameterized presentations, you can host it in the cloud (soon, there will be available online service runmercury.com for hosting notebooks).
Jupyter Notebook Presentations might be a great alternative to traditional presentation software. You will save time by building the presentation in the same environment where your code is. Any update in code or chart change will immediately affect the presentation - no need to manually copy-paste results. The parameterized presentation can take your slides one step further. Imagine your supervisor or manager playing with your slides and recomputing new charts.
Create interactive slides with Python in 8 Jupyter Notebook cells
Creating presentations in Jupyter Notebook is a great alternative to manually updating slides in other presentation creation software. If your data changes, you just re-execute the cell and slide chart is updated.
Jupyter Notebook is using Reveal.js (opens in a new tab) for creating slides from cells. The standard approach is to write slides code and Markdown in the Jupyter Notebook. When notebook is ready, it can be exported to standalone HTML file with presentation.
What if, you would like to update slides during the slide show? What is more, it would be fantastic to have interactive widgets in the presentation. You can do this in Mercury framework.
In this tutorial, we will create an interactive presentation in Jupyter Notebook and serve it with Mercury.
Create presentation in notebook
Please enable Slideshow toolbar in Jupyter Notebook. It can be done by clicking View -> Cell Toolbar -> Slideshow . It is presented in the screenshot below:

We will need following packages to create presentation in Python notebook:
Please make sure that they are installed in your environment.
1. Import packages and App setup
The first step is to import packages and setup Mercury App :
We setup title and description for App object.
Please note that we set Slide Type to Skip . This cell will not appear in the presentation.
2. Add title
The second cell is a Markdown with title:
The Slide Type is set to Slide . It is our first slide!
3. Add slide with Markdown
Add new Markdown cell with the following cell.
Please set Slide Type to Slide . It will be a second slide. I'm using ## as slide title ( # will produce too large title in my opinion).
4. Add Mercury Widget
Please add code cell with Text widget. We will use it, to ask users about their name.
We set Slide Type as Skip , so this cell will not appear in the presentation.
5. Display name
Let's use the name.value in the slide. Please add a code cell. We will display a Markdown text with Python variables by using Markdown function from Mercury package.
Please set the Slide Type to Slide .
You can display Markdown with Python variables by calling mr.Markdown() or mr.Md() functions. Both do the same.
The first five cells of the notebook:

You can enter your name in the widget during the notebook development. There will be no change in other cells. If you want to update the cell with new widget value, please execute it manually.
6. More widgets
We can add more widgets to the presentation. They will be used to control chart in the next slide.
We have used Slider and Select widgets. They are displayed in the notebook. This cell will not be displayed in the presentation, so set Slide Type to Skip .
7. Scatter plot
We will add a new code cell. It will have Slide Type set to Slide .
We used widgets values by accessing them with samples.value and color.value .
Screenshot of the notebook with scatter plot:

8. Final slide
Please add a last Markdown cell. Its Slide Type will be set to Slide :
Please notice that link is added with HTML syntax. There is a target="_blank" used to open link in a new tab.
Run presentation in Mercury
Please run Mercury local server in the same directory as notebook:
The above command will open a web browser at http://127.0.0.1:8000 . Please click on a card with presentation.
You can navigate between slides with arrows in the bottom right corner. You can enter the full screen mode by pressing F on the keyboard. Please use Esc to exit full screen mode.
You can change widgets values in the sidebar and presentation slides will be automatically recomputed:
You can export your slides as PDF or HTML by clicking Download button in the sidebar.
- Alumni & Careers
- News & Events
Turn your Jupyter Notebook into interactive Presentation Slides using Anaconda
Table of contents, download our sample and try it yourself, 1. open powershell prompt in anaconda, 2. change directory to current folder, 3. type jupyter nbconvert command, 1. enable slideshow view, explanation of each “slide type”, 3. add tag to hide code of charts on the slide, next article – host html file online.
In our “Learn Python From Zero For Absolute Beginner” series , you have learnt how to use Python to do some data manipulation tasks and create interactive charts using Plotly within Jupyter Notebook. After completing your analysis, it is common that you will need to deliver a presentation to present your findings. Traditionally, this might involve manually capturing screenshots of your notebook’s code and charts, and creating static slides using PowerPoint or Canva for your presentation. However, there is a more time-saving and dynamic approach, allowing you to convert your Jupyter Notebook into interactive slides . You can showcase your code , visualizations, and insights while retaining the interactivity of the Plotly charts you created. Give a try to this approach and captivate your audience with an interactive presentation experience derived directly from your Jupyter Notebook! At the end of this article, you will be able to convert your Jupyter Notebook (.ipynb file) to one single HTML file . By double clicking the HTML file, you can view your Jupyter Notebook content as below in the browser:
Before we proceed with configuring the settings in Anaconda to transform cells into slides, let’s first walk through the straightforward process of converting an .ipynb file to an HTML file .
To help you grasp the speed and simplicity of this conversion, please download our sample Jupyter Notebook (.ipynb file) here and follow the steps outlined below.
You may find the content in this .ipynb file familiar if you have been following our “Learn Python From Zero For Absolute Beginners” series as we have taken code snippets from the first two lessons and compiled them into this .ipynb file.

Convert ipynb file to HTML file

If you need guidance on how to install or use Anaconda, you can refer to our previous article here .
If you are a Mac user, you have the advantage of utilizing the Terminal directly on your Mac for the subsequent steps.

- Windows user: Powershell Prompt in Anaconda
- Mac user: Terminal in Mac
In the Powershell Prompt window or Terminal, use the cd command to change directory to the folder that you stored the .ipynb file.
Method 1: Using command below
Method 2: Drag and drop
Drag and drop the folder where storing the .ipynb file to the Powershell Prompt window or Terminal after typing cd .
Type the command below in the Powershell Prompt window. You may change sample.ipynb to the filename of your .ipynb file. This command uses nbconvert tool to convert an .ipynb notebook file into various static formats like HTML.
If you are using Terminal in Mac, you may need to execute the following command before executing the jupyter nbconvert command.
After executing the jupyter nbconvert command, an HTML file will be automatically generated in the current folder ( sample.slides.html in this case). The generated HTML file retains the content and structure of the ipynb Notebook, now conveniently presented in a slide format. One notable advantage is that the generated HTML file has a relatively small file size, which is beneficial for sharing and transferring files.
If you have a good understanding of HTML, you can further customize the generated HTML file, making modifications to the styling or content of the slides.

Configure settings in Jupyter Notebook to transform cells into slides
Before proceeding with the conversion process to HTML as outlined above, you need to make some configurations in Jupyter Notebook using Anaconda .
This configuration allows you to selectively choose which cells to display , ensuring that only the relevant content appears in the HTML output, showcasing the most important code snippets, explanations, and visualizations. This flexibility empowers you to tailor the HTML slides to your specific needs and deliver a concise and impactful presentation to your audience.
In the menu bar, click “ View ” → “ Cell Toolbar ” → “ Slideshow “.
2. Select Slide Type for each cell
After enabling the slideshow view, you can now select the “Slide Type” of each cell at the top right hand corner.
| Type | Explanation | |
|---|---|---|
| Slide | a main slide | |
| Sub-Slide | a sub-slide which will be shown when using the down arrow navigation (▼) | |
| Fragment | the cell content will be inside the main slide with a fade-in transition | |
| Skip | the cell content will not be displayed in the presentation slide | |
| Notes | speaker notes for the slide, the cell content will not be displayed in the presentation slide |
If you prefer showcasing charts or visualizations on the slides without including the corresponding code, you can assign specific tags to the desired cells.
In the menu bar, click “ View ” → “ Cell Toolbar ” → “ Tags “.
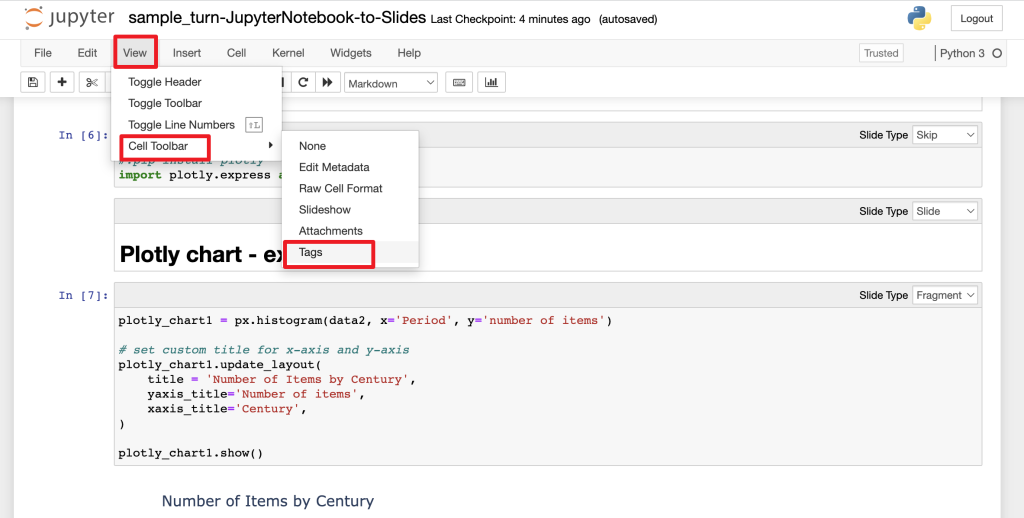
Type to_remove in the top right hand corner of the cell, and click “ Add tag “.

After configured each cell in Jupyter Notebook using Anaconda, you can now follow the steps in the previous section “Convert ipynb file to HTML file” to turn your Jupyter Notebook into interactive HTML Presentation Slides. The generated output is a single HTML file, making it incredibly convenient to share and save on a USB drive. Simply double-click on the HTML file to open it in any web browser. This portability and accessibility make it ideal for presenting in a classroom setting too. Good luck on your presentation!
As the converted file is in HTML format, you can also choose to host it as a website online like below. In our upcoming article, we will guide you through the process of hosting your HTML file on GitHub Pages. Stay tuned!
Kam, M. (2020, June 28). Creating an interactive presentation with Jupyter Notebook and Plotly. Things Michael Thinks. https://www.michaelkam.id/data-visualisation/2020/06/28/creating-an-interactive-presentation-with-jupyter-notebook-and-plotly.html
Krishnamurthy, D. (2015, December 5). Jupyter Notebook, Reveal.js and Github Pages. kdheepak. https://kdheepak.com/blog/jupyter-notebook-revealjs-and-github-pages
Mayeesha, T. (2018, February 12). Present your data science projects with Jupyter Notebook slides! Medium. https://medium.com/learning-machine-learning/present-your-data-science-projects-with-jupyter-slides-75f20735eb0f
– By Holly Chan , Library
October 6, 2023
You may also be interested in…

How to host your website on GitHub Page
Learn python from zero for absolute beginner (2): data visualization.

How to open .ipynb file (Jupyter Notebook)
Create a slide deck using Jupyter Notebooks

There are many options when it comes to creating slides for a presentation. There are straightforward ways, and generating slides directly from Jupyter is not one of them. But I was never one to do things the easy way. I also have high expectations that no other slide-generation software quite meets.
Why transition from slides to Jupyter?
I want four features in my presentation software:
- An environment where I can run the source code to check for errors
- A way to include speaker notes but hide them during the presentation
- To give attendees a useful handout for reading
- To give attendees a useful handout for exploratory learning
More Great Content
- Free online course: RHEL technical overview
- Learn Advanced Linux Commands
- Download Cheat Sheets
- Find an Open Source Alternative
- Read Top Linux Content
- Check out open source resources
There is nothing more uncomfortable about giving a talk than having someone in the audience point out that there is a coding mistake on one of my slides. Often, it's misspelling a word, forgetting a return statement, or doing something else that becomes invisible as soon as I leave my development environment, where I have a linter running to catch these mistakes.
After having one too many of these moments, I decided to find a way to run the code directly from my slide editor to make sure it is correct. There are three "gotchas" I needed to consider in my solution:
- A lot of code is boring. Nobody cares about three slides worth of import statements, and my hacks to mock out the socket module distract from my point. But it's essential that I can test the code without creating a network outage.
- Including boilerplate code is almost as boring as hearing me read words directly off of the slide. We have all heard (or even given) talks where there are three bullet points, and the presenter reads them verbatim. I try to avoid this behavior by using speaker notes.
- There is nothing more annoying to the audience when the talk's reference material doesn't have any of the speaker notes. So I want to generate a beautiful handout containing all of my notes and the slides from the same source. Even better, I don't want to have slides on one handout and a separate GitHub repository for the source code.
As is often the case, to solve this issue, I found myself reaching for JupyterLab and its notebook management capabilities.
Using Jupyter Notebooks for presentations
I begin my presentations by using Markdown and code blocks in a Jupyter Notebook, just like I would for anything else in JupyterLab. I write out my presentation using separate Markdown sections for the text I want to show on the slides and for the speaker notes. Code snippets go into their own blocks, as you would expect.
Because you can add a "tag" to cells, I tag any cell that has "boring" code as no_markdown .

(Moshe Zadka, CC BY-SA 4.0 )
Then I convert my Notebook to Markdown with:
There are ways to convert Markdown to slides —but I have no idea how to use any of them and even less desire to learn. Plus, I already have my favorite presentation-creation tool: Beamer .
But Beamer requires custom LaTeX, and that is not usually generated when you convert Markdown to LaTeX. Thankfully, one Markdown implementation– Pandoc Markdown —has a feature that lets me do what I want. Its raw_attribute extension allows including "raw" bits of the target format in the Markdown.
This means if I run pandoc on the Markdown export from a notebook that includes raw_attribute LaTeX bits, I can have as much control over the LaTeX as I want:
The --listings makes pandoc use LaTeX's listings package, which makes code look much prettier. Putting those two pieces together, I can generate LaTeX from the notebook.
Through a series of conversion steps, I was able to hide the parts I wanted to hide by using:
- LaTeX raw_attribute bits inside Jupyter Notebook's Markdown cells
- Tagging boring cells as no_markdown
- Jupyter's "nbconvert" to convert the notebook to Markdown
- Pandoc to convert the Markdown to LaTeX while interpolating the raw_attribute bits
- Beamer to convert the Pandoc output to a PDF slide-deck
- Beamer's beamerarticle mode
All combined with a little bit of duct-tape, in the form of a UNIX shell script, to produce slide-deck creation software. Ultimately, this pipeline works for me. With these tools, or similar, and some light UNIX scripting, you can make your own customized slide created pipeline, optimized to your needs and preferences.
What is the most complicated pipeline you have ever used to build a slide deck? Let me know about it—and whether you would use it again—in the comments.

Edit images with Jupyter and Python
Who needs to learn an image-editing application when you can do the job with open source tools you already know?

JupyterLab teaches Python developers magic
JupyterLab, the successor to Jupyter Notebook, feels like playing video games with the cheat codes enabled.

Markdown beginner's cheat sheet
Learn Markdown syntax to be ready to contribute to open source software.

Related Content

- Python Course
- Python Basics
- Interview Questions
- Python Quiz
- Popular Packages
- Python Projects
- Practice Python
- AI With Python
- Learn Python3
- Python Automation
- Python Web Dev
- DSA with Python
- Python OOPs
- Dictionaries
Creating Interactive Slideshows in Jupyter Notebooks
We all have been very well acquainted with the creation of slideshows by using Microsoft PowerPoint for our schools, colleges, or offices in our day-to-day lives. But, have we ever wondered how would it be to create a slideshow through the Jupyter Notebook? The advantages of creating slideshows with Python and Jupyter are its version control capability, dynamicity in the slideshows, easy sharing of codes with others in the groups, and a single presentation document, but the only con with this is that it doesn’t have many themes to apply in the slides, due to which it may look sort of a little plain.
In this article, we will walk through the different methods used for creating interactive slideshows in Jupyter Notebook like through RISE, with Jupyter’s built-in slideshow feature, Jupyter widgets, and ipywidgets and voila and voila-reveal. Also, we will read about the importance of creating interactive slideshows, how to customize our slides in the slideshows, and the processes involved in exporting the slideshow.
Now, coming to the basic query to ask everyone, and which every individual has in their mind is
Why Interactive SlideShow?
Some of the reasons why interactive slideshows are appreciated are mentioned below:
1. It easily helps in capturing audiences’ attention because of its interactive clickable elements, colours, images, videos, etc. making the presentation more memorable.
2. Users can delve further into data visualization s, charts, and graphs in interactive slideshows for data-driven presentations. To acquire deeper insights, they might filter data or zoom in on particular data points.
3. Interactive slideshows possess features like surveys and quizzes to collect feedback and gauge audience comprehension in real-time, which can be useful for training or instructional purposes.
4. Presenters can adapt their information to their audience’s demands by using interactive slideshows. Users can take their own route through the content by concentrating on the subjects that are most interesting or important to them, creating a more individualized experience.
Customizing Slides in Jupyter Notebook
Customizing slides refers to applying uniqueness to the appearance, content, and behaviour of individual slides to meet specific preferences. Similarly, we can also customize our slides in Jupyter Notebook. This can be done by adding metadata to the individual slides in the cells. Metadata is specified in the cell’s metadata tag, present under the “Cell Toolbar” option. From there you can customize the slide according to your own choice (Metadata is here referred to the information about the book, it is used to control the features and behavior of the notebook).
-(1).webp "jupyter lab create presentation")
The above image will apply “Edit Metadata” to all the slides.

You can now add any metadata to customize your slides as shown in the above image.
Exporting SlideShows in Jupyter Notebook
Once you are done with the creation and customization of the slides, you can export your slideshow from the Jupyter Notebook to your local machine. The slides can be exported in different formats such as HTML, PDF, LaTex, Reveal JS, Markdown (md), ReStructured Text (rst) and executable script. After exporting the file, save it in the same folder as that of where your Jupyter Notebook is installed. Finally, you will be able to easily present your slideshow from your local system to the outside world.
You can do so with the help of nbconvert tool. The nbconvert tool, is a Jupyter Notebook tool that converts notebooks to various other formats via Jinja templates. In order to used the nbconvert tool, you need to follow its basic command.
From the Command Line, use nbconvert to convert a Jupyter Notebook (input) to a different format (output). The basic command structure is given below:
where <output format> is the desired format in which the notebook is converted and <input notebook> is the filename of your own Jupyter Notebook which you want to convert.
For example: CONVERT JUPYTERNOTEBOOK SLIDESHOW TO HTML
This command creates an HTML file named as slideshow.ipynb.
Creating Interactive Slideshows in Jupyter Notebook using RISE
Step 1: set up all the requirements.
Installing Python and Jupyter Notebook
In order to start with the slideshows, firstly you need to install Python and Jupyter Notebook, using Anaconda Navigator.
Installing RISE
RISE , is an acronym which stands for Reveal.js IPython/Jupyter Slideshow Extension and as the name suggests RISE is a Jupyter Notebook extension that enables you to create dynamic presentation slides from your Jupyter Notebook. Through RISE, a notebook is rendered as a Reveal.js based slideshow during which you can execute code, display plots or show your audience any actions you would perform inside the notebook itself.
To use rise, first you need to install this. If you are using Anaconda then, use the command
or if you are using Command Prompt then use the command
You won’t be able to interact directly with RISE, instead you will be access it through your Jupyter Notebook.
Step 2: How to Create a SlideShow
Enabling slideshow mode.
To start with the creation of slideshows, you will need to start the Jupyter Notebook and open a new Notebook in it (must do this after installing RISE). Once you’re in the new fresh Notebook, you will need to enable the slideshow. For doing this, follow the following steps given below:
1. Click on the “View” tab in the Jupyter Notebook.
2. A dropdown menu will appear. Hover and select over the “Cell Toolbar” option.
3. Another dropdown appears. Now, select the “Slideshow” option in the “Cell Toolbar” menu.

You’ve now enabled the slideshow mode.
Creating the slides with cells
Now, at this point, start working with the cell toolbar present in the dropdown menu.

Once, you open the first cell in the Notebook, you’ll observe a “ Slide Type ” option present at the top right corner of the cell. This contains different types options which determines how each slide would fit in the slideshow. Those are:
slide – designates the selected cell as the first of a new slide.

sub-slide – indicates that the selected cell should be the start of a new sub-slide, which appears in a new frame beneath the previous slide.

fragment – denotes that the chosen cell should be added to the previous slide as a build.

skip – indicates that the selected cell should not be included in the slideshow and should instead be skipped.

notes – indicates that the selected cell should just be the presenter notes.

– – indicates that the selected cell should follow the behavior of the previous cell, which is useful when a markdown cell and a code cell should appear simultaneously.
Step 3: Viewing and Operating the SlideShows
Viewing the slideshow.
The slideshow can be seen directly from the notebook once the slide material has been created using cells for the slideshow.
There are two options to view the slideshow:
1. Using the shortcut ALT + R on Windows to enter and exit into the presentation mode within the notebook.
2. Clicking the “Presentation Mode” button from the notebook (Note that it would only appear if you’ve successfully installed RISE) as present at the right most, shown in the image given below.

Once you choose enter into the slideshow presentation mode, a window will open as shown below

This means the presentation is active now.
Operating the slideshow
Changing the slides.
When you enter in the slideshow window, you will see four different types of arrows in the bottom-right corner for controlling the slides. Although using the keys <- and -> may look attractive, but it can lead to skip of many sub-slides. Instead, its recommended to use SPACE for moving the slides forward and SPACE+SHIFT for moving the slides backward, respectively.
Apart from this, you may also access many other keyboard shortcuts within the slideshow by clicking the question mark (?) in the bottom-left corner.
Running and Editing the code
One of the best features of RISE is that you can update and run code while the presentation is in progress because it operates in a live Python session.
A code cell will show up in the slideshow as editable and runnable if it is identified as a slide, sub-slide, fragment, or -. Here’s an illustration:
Finally, you are done with the slideshow to showcase it to others.
Creating Interactive Slideshow using Jupyter’s built-in Slideshow Features
Until now, we learnt about the different ways of creating interactive slideshows in Jupyter Notebook with the help of RISE. But, there are some other methods too, which can be used for creating slideshows in Jupyter Notebook. One of them is “Jupyter’s built-in slideshow feature”. To create interactive slideshows in Jupyter Notebook with the help of its built-in feature, perform the following steps:
Step 1: Open a New Notebook
To start with, open a new notebook and rename it.
Step 2: Create new Slides
Once you are inside a new fresh notebook, start creating slides as much as you want to add in your slideshow.
Step 3: Enable SlideShow Mode
After you are done with the creation of all the slides, define them as specific slide-type such as “Slide”, “Sub-Slide”, “Fragment”, “Skip”, “Notes”, “Markdown”. Also, enable the slideshow mode through the “Cell Toolbar” in the Notebook toolbar.
Step 4: Run the Notebook for SlideShow
Next, save your notebook and close it. Open the Command Prompt, and run the below mentioned command to see your notebook as a slideshow.
Replace myslideshow.ipynb with your notebook filename. The above command will convert your Jupyter Notebook to a slideshow.
Creating Interactive Slideshow using Jupyter Widgets and IPYwidgets
Ipywidgets, is a python libraray, often termed as Jupyter widgets or simply widgets in short. With this, you can build interactive HTML widgets that will display in your Jupyter Notebook. They are interactive Graphical User Interface (GUI) elements which incorporate user interaction into your code, enhancing the interest and usefulness of your notebooks. They are especially beneficial for activities like data exploration, data analysis, parameter adjustment, and concept demonstration.
There are many different controls available with Jupyter widgets, including buttons, sliders, text input fields, dropdown menus, checkboxes, and more. These features allow for real-time data manipulation and display, parameter changes, and action triggering without the need to run code cells again.
Jupyter widgets or ipywidgets, also helps in building interactive slideshows. You just need to apply the following steps:
Step 1: Install IPYwidgetsINSTALL ‘IPYWIDGETS’
In order to start working with widgets, you need to first install it. For this, you can use Command Prompt or Anaconda.
Step 2: Import the Libraries
In the next step, import the necessary required libraries in your notebook.
Step 3: Create Interactive Widgets
Now, select the type of interactive widget, you want to include in your presentation. For example, here I have used the slider widget.
Here, we can assign the min and max value, step value and the description of the slider.
Step 4: Display the Widgets
This will display the widget which is applied to the slide.
Step 5: Run the SlideShow
Next, when you are done creating the widgets for all the specific slides, turn on the slideshow mode. To do this, go to View -> Cell Toolbar -> Slideshow. Thereafter, use the “Slide Type” dropdown menu in the toolbar to specify how each cell should be treated (e.g., slide, sub-slide, fragment, skip and notes).
Step 6: Start the Slideshow
Finally, start the slideshow by clicking the “Enter/Exit Live Reveal Slideshow” button in the toolbar. Your presentation will begin, and interactive widgets will be functional.
Creating Interactive Slideshow using Voila and Voila-Reveal
Voila is an open-source framework or we can say a web application, with the help of which one can convert Jupyter notebooks into dashboards and interactive online applications. Although it’s primarily responsible for creating web applications, it can also be used to create interactive slideshows for Jupyter notebooks.
On the other hand, Voila-Reveal is just an extension of voila. It allows to convert simple jupyter notebook into a Reveal.js based interactive slideshow.
In order to do so, one can follow the below mentioned steps:
Step 1: Install VOILA
To install voila, you can use Command Prompt
Step 2: Create the Slides
Then, create or open Notebook where you will build the presentation. If you want to customize the slides using Reveal.js features like slide backgrounds, transitions, and themes, then do so by adding appropriate metadata to Markdown cells.
-(1).webp "jupyter lab create presentation")
Step 3: Run VOILA
Once you created the slides, close your notebook. Then, in the command prompt, navigate to the path where your notebook is stored.
Replace C:\Users\hp with your folder path.
Then, start to run your notebook in the Command Prompt.
Rename Voila.ipynb with the name of your notebook file.
Once you run your file, voila will start a local server and generate the Reveal.js-based presentation from your notebook. It will provide you with a URL, which is typically something like http://localhost:8866 . Open this URL in a web browser to view your interactive slideshow presentation.
-(1)-(1).webp "jupyter lab create presentation")
NOTE : Voila will convert all the slides in the cells in the notebook to a dashboard.
Please Login to comment...
Similar reads.
- Geeks Premier League
- Geeks Premier League 2023
- Jupyter-notebook
- Best External Hard Drives for Mac in 2024: Top Picks for MacBook Pro, MacBook Air & More
- How to Watch NFL Games Live Streams Free
- OpenAI o1 AI Model Launched: Explore o1-Preview, o1-Mini, Pricing & Comparison
- How to Merge Cells in Google Sheets: Step by Step Guide
- #geekstreak2024 – 21 Days POTD Challenge Powered By Deutsche Bank
Improve your Coding Skills with Practice
What kind of Experience do you want to share?
Natalie B. Hogg
Cosmologist
Using a Jupyter notebook to make presentation slides

- Open a blank Jupyter notebook.
- Add a cell and convert it to Markdown (either esc + m ) or by using the drop down menu at the top of the notebook.
- Add your text, equation or image to the cell (images can be added via the edit menu, though some HTML tags may be needed to render and/or resize the image).
- Choose a slide type in the drop down menu of the cell itself (slide, sub-slide, fragment, skip or notes).
- Save the notebook.
- In the terminal, run jupyter nbconvert *.ipynb --to slides .
- Open the resulting .html file in a browser and use the arrow keys to navigate.
I turn coffee Lapsang Souchong tea into code; if you found this post useful you can contribute to my habit here: https://ko-fi.com/nataliebhogg .
I’m in a strange kind of limbo at the moment. I’m not being paid, since I can’t sign my new contract without being physically present in Spain. And, until the 30th of March, it was physically impossible to enter Spain unless you were a Spanish resident, since the borders were closed due to Covid restrictions. Due to Brexit, I also need a visa in order to be able to stay in Spain for more than ninety days and to legally work there. So, I have an appointment at the Spanish consulate in London on Friday to submit my visa application. I’m hoping for a quick decision so I can book a flight, get to Madrid, sign my contract and start working (and drawing a salary). But, until then, I’m in this strange, semi-working state.
I could have taken this time off completely, but with the UK in lockdown and everything shut, I know I would have quickly got bored in the face of a two or three month holiday with nothing to do and nowhere to go. So, I resolved to keep working, despite the lack of pay, albeit at a reduced pace. I’ve been attending journal clubs and mainly working on turning a chapter of my PhD thesis into a paper.
As a result, it was nice to take a full five days off over the Easter weekend. I finished reading three books: Island of Dreams by Dan Boothby (ok if you are interested in Gavin Maxwell, Scotland or otters), The Nine Tailors by Dorothy L. Sayers (which I highly recommend!) and Never Split the Difference by Chris Voss (probably only useful if you’re a hostage negotiator or someone working in big business). It was a conscious decision to try and read more and I’m glad it paid off. I always forget how refreshed I feel after even just a couple of days off from work.
This morning I finished making my slides for my talk at Britgrav next week. I’m going to be presenting my work from a few months ago on how the distance duality relation can be constrained with standard sirens and how modified gravity effects can bias this type of analysis. I tend to use either Google Slides or LaTeX Beamer to make presentations, depending on the content and audience, but this time I decided to use Markdown in a Jupyter Notebook which I then converted to HTML.

This produces very clean looking slides, and it’s easy to write LaTeX commands too (unlike in Google Slides).

The process I followed to create the slides is very simple.
The same week that I’m giving this talk, I’m also presenting the H0 review paper by Di Valentino et al (we’re having a special H0 tension week, as someone else is going to present Efstathiou’s recent offering on the same topic) and the following week I’ve been invited to give a seminar at my old undergraduate institution, Aberystwyth University, which I’m really looking forward to.
Share this:
- Click to share on Twitter (Opens in new window)
- Click to share on Facebook (Opens in new window)
Natalie Hogg
Leave a comment Cancel reply

- Already have a WordPress.com account? Log in now.
- Subscribe Subscribed
- Copy shortlink
- Report this content
- View post in Reader
- Manage subscriptions
- Collapse this bar
Presenting with Jupyter Notebooks
The best way to walk through this tutorial is using the accompanying jupyter notebook:.
[ Jupyter Notebook ]
In the last year I’ve started presenting work using Jupyter Notebooks, rebelling against the Bill Gates'-driven status-quo. Here I’ll explain how to do it. It’s not difficult, but in my opinion makes presentations look slicker, whilst allowing you to run code live in a presentation if you like. First, we need to download the plug-in that gives us the presentation functionality, it’s called RISE . We can do this easily using pip in a terminal window:
Once installed, our first move is to add the presentation toggles to our notebook cells. We do this by clicking View in the menu bar, then Cell Toolbar , then Slideshow :
Adding Presentation Toggles to Cells
Slide types.
This adds a Slide Type dropdown to each cell in the notebook. Here we can choose one of five options:
- Slide : Used to start a new chapter in your presentation, think of this as a section heading in LaTeX.
- Sub-slide : Slide falling within the chapter defined by a Slide cell.
- Fragment : this is to split the contents of one slide into pieces; a cell marked as a fragment will create a break inside the slide; it will not show up right away, you will need to press Space one more time to see it.
- Skip : Skips cell when in presenter mode.
- Notes : Cell that allows the author to write notes on a slide that aren’t shown in presenter view.
As with any notebook, we can define the cell type to be either Markdown or Code . As you’d expect, we present any text or image-based slide in Markdown , reserving the Code cell type if and only if we want to explicitly run some code in the presentation. If you aren’t familiar, Markdown is a straightforward language for text formatting; I won’t go into the details here, but suffice to say you can learn the basics of Markdown in 5 minutes. You can find a useful cheatsheet here .
Adding images is easy too. I advise creating a sub-directory in your working directory called /images and storing anything you want to present there. Then you display them in a markdown file using some simple HTML syntax:
<img class="" src="images/london_deaths.jpeg" style="width:75%">
You can manipulate the style attribute to change the size of the image. Don’t worry, this is the only HTML you need to know!

Entering Presentation Mode
To view your slideshow click on the bar-chart button in the menu bar. This will start the presentation from the cell currently selected:
That’s it! This tutorial has given you an introduction to the basics of RISE for presenting with Jupyter Notebooks, you can of course customise these to your heart’s content using further plug-ins and more advanced Markdown. Here’s a summary of the useful links from this document to finish:
- RISE Documentation
- Markdown Cheatsheet
- Markdown Table Generator
Twitter: @enjeeneer
Website: https://enjeeneer.io/.

Creating a Presentation with Jupyter Notebook and RISE (Video)
In this tutorial, you will learn how to use Jupyter Notebooks to create slide show presentations. This allows you to run and edit live code in your slides.
Want to learn more about Jupyter Notebook? Then check out my book, Jupyter Notebook 101 , available on Leanpub , Amazon , and Gumroad
Creating presentations from Jupyter notebooks
January 12, 2022
2022 · python jupyter data visualization
The Jupyter notebook, controversial though it may be , is a core data exploration and experimentation platform for many in the data and scientific communities. In particular, its combination of REPL-like input and embedded HTML output make for an ideal means of generating and analyzing data tables and visualizations. This is great for sharing information with others – and, it turns out, the Jupyter ecosystem includes tooling to quickly generate reveal.js presentations using the included nbconvert library.
Getting started
For local service, you’ll need to provide a path to the reveal.js library. It’s probably easiest to clone it into the working directory of your notebook:
Then, run the export command to initiate the reveal.js service:
The --to option actually accepts a number of possible output formats, including PDF (try jupyter nbconvert --help to see other options), but the slides argument targets reveal.js slides. --reveal-prefix should point to your local reveal.js directory, and --post serve specifies that the reveal.js serve command should be run following conversion (a tab containing the live presentation should be opened on your default browser).
By default, every cell is treated as a unique slide, but you have some basic control over how cells are turned into reveal.js objects. First, select the “slideshow” view from the menu:

You can choose from a few different slide types for each cell:

“Sub-slide” creates a separate slide which is grouped within the closest “Slide” (in reveal.js presentations, lateral movement will change parent “Slide” groups, while vertical movement will proceed within an individual slide grouping). A “fragment” will be conjoined to the previous slide/sub-slide, but will be revealed on an extra enter/arrow-key press/click (sort of like the “appear” animation in Powerpoint progressively reveals individual bullet points).
A few closing notes:
The nbconvert docs suggest reverting your reveal.js source to version 3.5 (via git checkout 3.5.0 in the reveal.js repo). I found that this broke some things and do not recommend it.
Jupyter notebooks don’t immediately auto-save state, so remember to click the “save and checkpoint” button before exporting to ensure that you capture the most recent iteration of your work.
Theoretically the HTML output should be able to pull requisite scripting from a reveal.js CDN, but it didn’t seem to work for me ¯\_(ツ)_/¯ . Maybe there are more --reveal-prefix related options? Who knows.
Critically, reveal is flexible about sizing for a lot of things, but will struggle with images (and probably code output), so make sure to double-check that any visual output looks right in a presentation beforehand (you may need to resize it)
Nikolai Janakiev
All things data // data science / data engineering / data visualization / GIS
© 2024. All rights reserved.
home · about · projects

Creating Slides with Jupyter Notebook
Table of contents, preparation, convert slides for reveal.js, serve slides with https server, export as pdf.
Jupyter notebook is a powerful tool to interactively code in web-based notebooks with a whole plethora of programming languages. With it, it is also possible to create web-based slideshows with reveal.js .
The slides functionality is already included in Jupyter Notebook, so there is no need to install plugins. Although slides do not work at the time of writing for JupyterLab . To open the slides toolbar for each cell in your Jupyter Notebook, enable it via View > Cell Toolbar > Slideshow :

Now you can specify for each cell what kind of slide type you want. The available types are Slide (new slide), Sub-Slide (new slide below last one), Fragment (fragment within previous slide), Skip (skip this cell) and Notes (adding speaker notes):

You can now convert the notebook with the jupyter-nbconvert command line tool and the --to slides option. First, you need to add/clone reveal.js into your folder with the presentation ( git clone https://github.com/hakimel/reveal.js/ ) and then you can run the command:
If you want to enable scrolling you can add the following to the jupyter nbconvert command (thanks to Hannah Augustin for the hint):
It is also possible serve slides with an https server by using the --post serve option as in the command:
This will run a server which opens the presentation in your browser ready for presentation. Another neat thing is RISE , a Jupyter slideshow extension that allows you to instantly turn your Jupyter Notebooks into a slideshow with the press of a button in your notebook:

Finally, if you want to create a PDF from your slides, you can do that by adding ?print-pdf to the url of the previously hosted slides:
After opening this url, you can now print the page to PDF. You can find other configuration options in the nbconvert documentation .
Happy presenting!
Related Posts
Installing and running jupyter on a server 12 feb 2019, manage jupyter notebook and jupyterlab with systemd 10 nov 2020, remove jupyter notebook output from terminal and when using git 06 nov 2021.
- Manage Email Subscriptions
- How to Post to DZone
- Article Submission Guidelines
- Manage My Drafts
Cloud + data orchestration: Demolish your data silos. Enable complex analytics. Eliminate I/O bottlenecks. Learn the essentials (and more)!
2024 DZone Community Survey: SMEs wanted! Help shape the future of DZone. Share your insights and enter to win swag!
Security Virtual Roundtable: Join DZone SMEs as they discuss software supply chains, the role of AI/ML in security, CNAPP, and more.
Enterprise Security: Now is the time to ensure your systems are secure. Expand your org's tactics and put future attackers in their place.
- Norm of a One-Dimensional Tensor in Python Libraries
- Improving Sentiment Score Accuracy With FinBERT and Embracing SOLID Principles
- Apache Flink
- How To Use Amazon SageMaker for Machine Learning
- Accelerate Your Journey to a Modern Data Platform Using Coalesce
- Data Storage Formats for Big Data Analytics: Performance and Cost Implications of Parquet, Avro, and ORC
- Zero To AI Hero, Part 2: Understanding Plugins in Semantic Kernel, A Deep Dive With Examples
- DZone Annual Community Survey: What's in Your 2024 Tech Stack?
Creating Presentations With Jupyter Notebook
When you build a presentation using jupyter notebook, you'll be able to run code live from your slides..
Join the DZone community and get the full member experience.
Jupyter Notebook can be turned into a slide presentation that is kind of like using Microsoft PowerPoint, except that you can run the slide's code live! It's really neat how well it works. The only con in my book is that there isn't a lot of theming that can be applied to your slides, so they do end up looking a bit plain.
In this article, we will look at two methods of creating a slideshow out of your Jupyter Notebook. The first method is by using Jupyter Notebook's built-in slideshow capabilities. The second is by using a plug-in called RISE .
Let's get started!
The first thing we need to do is to create a new Notebook. Once you have that done and running, let's create three cells so that we can have three slides. Your Notebook should now look like the following:

An empty notebook with 3 cells
Now let's turn on the "slideshow" tools. Go to the View menu and then click on the Cell Toolbar menu option. You will find a sub-menu in there that is called Slideshow . Choose that. Now your Notebook's cell should look like this:

An empty slideshow
There are now little comboboxes on the top right of each cell. These widgets give you the following options:
You can just create a series of Slides if you like, but you can make the slideshow a bit more interesting by adding Sub-Slides and Fragments. Sub-slides are just slides that are below the previous one while Fragments are basically fragments within the previous slide. As an aside, I have actually never used Fragments myself. Anyway you can also set a slide to Skip, which just allows you to skip a slide or Notes, which are just speaker notes.
Let's add some text to our first cell. We will add the text "# Hello Slideshow" to it and set the cell type to Markdown. Note the pound sign at the beginning of the text. This will cause the text to be a heading.
In cell two, we can add a simple function. Let's use the following code:
For the last cell, we will add the following text:
Make sure you set that to be a Markdown cell as well. This is what my cells ended up looking like when I was done:

Getting the slideshow ready
To make things simple, just set each of the cell's individual comboboxes to Slide .
Now we just need to turn it into an actual slideshow. To do that, you will need save your Notebook and shut down the Jupyter Notebook server. Next you will need to run the following command:

Running the slideshow
To navigate your slideshow, you can use your left and right arrow keys or you can use spacebar to go forward and shift_spacebar to go back. This creates a pretty nice and simple slideshow, but it doesn't allow you to run the cells. For that, we will need to use the RISE plugin!
Getting Started With RISE
Reveal.js - Jupyter/IPython Slideshow Extension (RISE) is a plugin that uses *reveal.js* to make the slideshow run live. What that means is that you will now be able to run your code in the slideshow without exiting the slideshow. The first item that we need to learn about is how to get RISE installed.
Installing rise with conda
If you happen to be an Anaconda user, then this is the method you would use to install RISE:
This is the easiest method of installing RISE. However most people still use regular CPython, so next we will learn how to use pip!
Installing rise with pip
You can use Python's pip installer tool to install RISE like this:
You can also do `python -m pip install RISE` if you want to. Once the package is installed, you have a second step of installing the JS and CSS in the proper places, which requires you to run the following command:
If you somehow get a version of RISE that is older than 5.3.0, then you would also need to enable the RISE extension in Jupyter. However, I recommend just using the latest version so you don't have to worry about that.
Using RISE for a SlideShow
Now that we have RISE installed and enabled, let's re-open the Jupyter Notebook we created earlier. Your Notebook should now look like this:

Adding RISE
You will notice that I circled a new button that was added by RISE to your Notebook. If you mouse over that button you will see that it has a tooltip that appears that says "Enter/Exit RISE Slideshow." Click it and you should see a slideshow that looks a lot like the previous one. The difference here is that you can actually edit and run all the cells while in the slideshow. Just double-click on the first slide and you should see it transform to the following:

Running with RISE
After you are done editing, press SHIFT+ENTER to run the cell. Here are the primary shortcuts you will need to run the slideshow effectively:
- SPACEBAR - Goes forward a slide in the slideshow
- SHIFT+SPACEBAR - Goes back a slide in the slideshow
- SHIFT+ENTER - Runs the cell on the current slide
- DOUBLE-CLICK - To edit a Markdown cell
You can view all the Keyboard shortcuts by going to the Help menu when not in Slideshow mode and clicking the Keyboard Shortcuts option. Most — if not all — of these shortcuts should work inside a RISE slideshow.
If you want to start the slideshow on a specific cell, just select that cell and then press the Enter Slideshow button.
RISE also works with Notebook widgets. Try creating a new cell with the following code:
Now start the slideshow on that cell and try running the cell (SHIFT+ENTER). You should see something like this:

Using a widget in RISE
You can use RISE to add neat widgets, graphs and other interactive elements to your slideshow that you can edit live to demonstrate concepts to your attendees. It's really quite fun and I have used RISE personally for presenting intermediate-level material in Python to engineers.
RISE also has several different themes that you can apply as well as minimal support for slide transitions. See the documentation for full information.
Wrapping Up
In this chapter we learned about two good methods for creating presentations out of our Jupyter Notebooks. You can use Jupyter directly via their nbconvert tooling to generate a slideshow from the cells in your Notebook. This is nice to have, but I personally like RISE better. It makes the presentations so much more interactive and fun. I highly recommend it. You will find that using Jupyter Notebook for your presentations will make the slides that much more engaging and it is so nice to be able to fix slides during the presentation too!
Related Reading
- Presenting code using Jupyter Notebook
- The RISE Github page
- Jupyter nbconvert Usage
- How to build interactive presentations with Jupyter Notebook and Reveal JS
Published at DZone with permission of Mike Driscoll , DZone MVB . See the original article here.
Opinions expressed by DZone contributors are their own.
Partner Resources
- About DZone
- Support and feedback
- Community research
- Advertise with DZone
CONTRIBUTE ON DZONE
- Become a Contributor
- Core Program
- Visit the Writers' Zone
- Terms of Service
- Privacy Policy
- 3343 Perimeter Hill Drive
- Nashville, TN 37211
- [email protected]
Let's be friends:
Things Michael Thinks
Data science in learning, creating an interactive presentation with jupyter notebook and plotly.
Let’s say you have performed some analysis using Jupyter notebook and produced some great visualisations to back up your finding. How would you present this to your stakeholders and other people? One great way to ace this is to convert your jupyter notebook and plotly graphs to an interactive presentation that can impress people.
Introduction
I learned on creating slides using Jupyter Notebook from Tahsin Mayeesha’s medium post . However, I was curious to see if I can incorporate interactive graphs from Plotly in the slides. Therefore, I wrote this post to share what I’ve learned.
For this post, I will use the Titanic dataset from Kaggle . This dataset is a classic dataset used to learn machine learning models on classification problems.
In this case, my aim was to present my finding from an Exploratory Data Analysis on the Titanic dataset. I would include several visualisations and slides to show what you can do with Jupyter markdown and slides. Although I would use Plotly mostly for the slides, I have also included one plot with Seaborn and one plot from Pandas Profiling library to show the possibilities you can do.
For my presentation, I imported the following visualisation libraries.
- Plotly, including the Plotly Express and Plotly Graph Objects
- Pandas Profiling visualisation for missing values in the dataframe.
All the libraries above are not required to make the slides work, you can just simply use Plotly , Seaborn , or even simply Matplotlib . You can check the full notebook on my GitHub repo here .
Jupyter Notebook Slideshow View and Setting

Changing the view will allow you to set what type of slides you want for each cell. There are 5 Slide Types you can select:
- Slide . This is the main content of a slide. You can place markdown, visuals, or even code here.
- Sub-Slide . I will consider this as a new slide with transition animation. You have to use the down arrow navigation to access it from the main slide (Slide type).
- Fragment . This will be a part or component of the immediate previous cell with Slide Type. For example, one cell with the heading will be set as Slide and the visualisation will be set as Fragment. The fragment will be inside the main slide but with a fade-in transition.
- Skip . This cell will not be shown on the slides. Perfect for code and comment cells that you won’t show. Be aware that you can’t put skip for your visualisation code because the output will not be shown as well.
- Notes . This will create Speaker notes, but I haven’t tried this function. From the NbConvert reference , you need to have a local copy of the Reveal.JS file to allow you having a presenter view with the notes.
Skip type for Non-Visualisation Code Cell

Slide type for Title and Markdown Cell
For the first slide or the cover, I will only use one markdown cell with title, subtitle, and author.

Slide + Fragment types for Mixture of Markdown and Code Cells

Hiding the Codes on the Slide

Specific for Plotly
If you use plotly, then you need to pay attention in this section. Otherwise, your plotly graphs won’t show up in the slides.
Plotly will require its JavaScript file ( plotly.js ) to produce the graph. There are three options you can choose:
- A local copy of JavaScript file. This is the easiest and simplest way to ensure the Plotly graphs to work. You can download the latest JS file from this link and rename it into plotly.js. This file needs to be in the same folder or directory with the resulting HTML slides file.
- Refer to CDN online. This is a great option if you want a lightweight HTML file and have constant access to the Internet. This is perfect if you want to embed the slides on a website. To do this, create a new code cell at the beginning, include this code here: from IPython.display import Javascript Javascript ( """require.config({ paths: { plotly: 'https://cdn.plot.ly/plotly-latest.min' } });""" )
The get_plotlyjs function would return the whole minified Plotly JS script and by using the Javascript function from IPython we include this in the notebook. The resulting file would be 3MB larger because of the inclusion. However, you will only have one HTML file that you can just send or use anytime.
Converting the Notebook to Slides
To produce the slides from the jupyter notebook, run the following code on your command prompt or bash:
Here we are calling nbconvert function that can be used to convert the notebook into slides (HTML format with Reveal.js) or other formats as can be referred on the documentation .
The TagRemovePreprocessor will remove any code with to_remove tag as we specified. Again, this can be replaced with any other tag you specified before hand.
If you check your directory, the html version of your notebook will be there. You can open this on the web browser and use the directional pad on the screen or arrow keys on your keyboard to navigate. I was able to open the file and interact with Plotly graphs successfully using Chrome, Firefox, Opera, and Microsoft Edge. I heard this might not work so well with Safari but I can’t confirm this.
For me personally, I found that using --post serve , I could not terminate the server using Ctrl-C as described even after many tries. However, I also found that I can omit this in my command prompt and still get the HTML slides file.
Final Output of the Slides
Here are the following slides I produced from my jupyter notebook that you can find on GitHub
DEV Community
Posted on Aug 22, 2021 • Updated on Jun 24
Create dynamic and content rich presentations in Jupyter
Jupyter is an effective tool for data analysis whether it is classic notebook, lab, or notebooks in popular text editors like VS code. You do analysis but when it comes to presenting your results, most of the time you need to move out of the ecosystem. Currently there are many tools to present your analysis to non-technical people without showing code cells including voila, reveal slides etc. These tools present either static html or slides of plain cell outputs, so you do not have a fine grain control over content. Facing all such difficulties, I decided to leverage the IPython's rich content capabilities for creating presentation without leaving notebook. The resultant package ipyslides is in active development and can use every kind of content from widgets, audio, video, HTML etc. Without more intro, let's dig into code a little bit.
The most preferred environment is jupyterlab, so after having that installed, you can do
You can start creating presentation like this:
Below slide will give same result as above:
Both %%slide and with Slides.build save results to IPython's capture mechanism. There is another way where you can add slide frames:
This will create three frames. Now let's create multiple slides from single cell using context manager:
Show Slides
slides object at end of cell automatically displays itself, you can also do this explicitly:

You have write command to write Markdown, HTML and plots after using plt2html and plotly2html . You can extend to other plotting libraries, or you can simply use native commands like plt.show , fig.show etc.
You can see comprehensive demo at Binder where rich content like YouTube video, tables, graphs, widgets are embedded.
Top comments (0)
Templates let you quickly answer FAQs or store snippets for re-use.
Are you sure you want to hide this comment? It will become hidden in your post, but will still be visible via the comment's permalink .
Hide child comments as well
For further actions, you may consider blocking this person and/or reporting abuse

Matplotlib Colormap Normalization: Visualizing Nonlinear Data
Labby - Aug 18

How the New iPhone, Development, and Cryptocurrencies Are Connected
Dmytro Klimenko - Sep 10

Manage Multiple GitHub Accounts with SSH Keys
kshitij Bhatnagar - Aug 21

Create an end-to-end personalised AI chatbot🤖 using Llama-3.1🦙 and Streamlit powered by Groq API
Debapriya Das - Sep 8

We're a place where coders share, stay up-to-date and grow their careers.
Navigation Menu
Search code, repositories, users, issues, pull requests..., provide feedback.
We read every piece of feedback, and take your input very seriously.
Saved searches
Use saved searches to filter your results more quickly.
To see all available qualifiers, see our documentation .
- Notifications You must be signed in to change notification settings
Slideshow extension for JupyterLab.
JoaoFelipe/nbslide
Folders and files.
| Name | Name | |||
|---|---|---|---|---|
| 4 Commits | ||||
| workflows | workflows | |||
Repository files navigation
Slideshow extension for JupyterLab. This extension adds a presentation mode for Jupyter Lab that hides cells during a presentation to help the audience focus on the part that matters.
In comparison to RISE , nbslide is a simpler extension that keeps the notebook look and feel and executes cells automatically during the presentation mode.
Why did you make this?
RISE is a great tool for general presentations, but the usage of reveal.js makes it not look much like a notebook. I was preparing a presentation that introduces Jupyter and faced the dilemma of using RISE and losing the look of a notebook, or running the notebook directly and losing the focus of the audience.
Additionally, I had made a similar extension for old jupyter notebooks before when I faced the same dilemma in a previous presentation. Thus, I decided to port it to Jupyter Lab, extend it to support the configuration of Slides, and make it more generic.
For configuring the Slideshow, nbslide uses the same options in the "Cell Toolbar" as RISE. However, the types may have a slightly different behavior:
- slide : this cell is the beginning of a new slide (same behavior)
- subslide : this cell is also the beginning of a new slide, but displaying it hides everything up to (and including) its main slide . It is useful for presenting changes on cells, since the default definition of slides displays them all sequentially.
- fragment : this cell can be part of a slide or a subslide. It is hidden at first glance, but becomes visible once you advance the slide (same behavior as RISE). Note that in our case the behavior is not much different than setting a cell as a new slide . However, a fragment is also hidden for the exihibition of a subslide .
- skip : this cell is ignored and never displayed during the presentation (same behavior as RISE).
- notes : currently, nbslide does not have a speaker view, so it is the same as skip .
Additional configurations
In addition to these cell types it is also possible to add tags to cells for additional behaviors:
- skiprun : prevents code cell from running during the slide display
- noscroll : prevents the notebook scroll to move to the cell during the slide display
Finally, it is also possible to include additional properties to the "slideshow" metadata in the cell:
- slide_title : defines the current slide title. By default, it uses the notebook name.
- slide_suffix : defines the suffix of the title. By default, it reads and updates from Header elements.
- slide_autosuffix : deactivate (and reactivate) the update of suffixes based on header elements.
The default shortcuts of nbslide are also different than the ones from RISE. We borrow shortcuts from Google presentations/Powerpoint:
- Ctrl+F5 : Start/Stop presentation in the current slide.
- Ctrl+Shift+F5 : Start presentation from the first slide.
- Right Arrow : Move to the next slide. If it is hidden, nbslide executes all of its cells.
- Left Arrow : Hide current slide and go to the previous one.
- \ : Display current slide withou trying to execute it. Note that it is possible to use Down and Up arrows to navigate normally on the cells of the notebook, including the ones that are hidden.
Requirements
- JupyterLab >= 3.0
To install the extension, execute:
To remove the extension, execute:
Contributing
Feel free to submit pull requests and open issues.
Development install
Note: You will need NodeJS to build the extension package.
The jlpm command is JupyterLab's pinned version of yarn that is installed with JupyterLab. You may use yarn or npm in lieu of jlpm below.
You can watch the source directory and run JupyterLab at the same time in different terminals to watch for changes in the extension's source and automatically rebuild the extension.
With the watch command running, every saved change will immediately be built locally and available in your running JupyterLab. Refresh JupyterLab to load the change in your browser (you may need to wait several seconds for the extension to be rebuilt).
By default, the jlpm run build command generates the source maps for this extension to make it easier to debug using the browser dev tools. To also generate source maps for the JupyterLab core extensions, you can run the following command:
Development uninstall
In development mode, you will also need to remove the symlink created by jupyter labextension develop command. To find its location, you can run jupyter labextension list to figure out where the labextensions folder is located. Then you can remove the symlink named nbslide within that folder.
- TypeScript 80.3%
- Python 14.2%
- JavaScript 5.0%
- Stack Overflow for Teams Where developers & technologists share private knowledge with coworkers
- Advertising & Talent Reach devs & technologists worldwide about your product, service or employer brand
- OverflowAI GenAI features for Teams
- OverflowAPI Train & fine-tune LLMs
- Labs The future of collective knowledge sharing
- About the company Visit the blog
Collectives™ on Stack Overflow
Find centralized, trusted content and collaborate around the technologies you use most.
Q&A for work
Connect and share knowledge within a single location that is structured and easy to search.
Get early access and see previews of new features.
Jupyter Notebook Slides in VScode
In Jupyter Notebook we could create slides, like explained here . Here you can see a reproducible example to create Jupyter notebook slides via Anaconda-navigator:

When running this command in the terminal:
It will outputs this in your browser:

And for the code cell output:

This is very nice and I would like to use this but in VScode .
In the Jupyter notebook of Anaconda navigator we can create slides when clicking on View -> Cell Toolbar -> Slideshow in the header bar. Unfortunately, this is not possible in VScode. So I was wondering if anyone knows how to create Jupyter Notebook slides in VScode?
- visual-studio-code
- jupyter-notebook
- 1 It seems there is a VSCode extension to use slides: marketplace.visualstudio.com/… . I haven't tried it though...maybe it's worth taking a look. – matleg Commented Jul 5, 2023 at 14:02
Firstly, ensure that you have install Jupyter extension .

It will install several extensions required for Jupyter including slides for you.
Then, you can add a slide type to the cell you're on by opening the Command Palette (Cmd+Shift+P) and selecting Switch Slide Type according to the document in GitHub .

You could modify slide types for notebook cells by selecting the slide type on the cell.

After assigning slide types to your cells, create an HTML slideshow presentation by opening the integrated terminal and running the command, jupyter nbconvert '<notebook-file-name>.ipynb' --to slides --post serve .
Your Answer
Reminder: Answers generated by artificial intelligence tools are not allowed on Stack Overflow. Learn more
Sign up or log in
Post as a guest.
Required, but never shown
By clicking “Post Your Answer”, you agree to our terms of service and acknowledge you have read our privacy policy .
Not the answer you're looking for? Browse other questions tagged python visual-studio-code jupyter-notebook slideshow or ask your own question .
- The Overflow Blog
- The world’s largest open-source business has plans for enhancing LLMs
- Looking under the hood at the tech stack that powers multimodal AI
- Featured on Meta
- Join Stack Overflow’s CEO and me for the first Stack IRL Community Event in...
- User activation: Learnings and opportunities
- What does a new user need in a homepage experience on Stack Overflow?
- Announcing the new Staging Ground Reviewer Stats Widget
Hot Network Questions
- My team is not responsive to group messages and other group initiatives. What should be the appropriate solution?
- (How) is it possible to let portable communication devices detonate via software?
- Fear of getting injured in Judo
- Emergency belt repair
- How can I assign a heredoc to a variable in a way that's portable across Unix and Mac?
- How large can a network of underground tunnels be before it collapses on itself?
- Counting the number of meetings
- How to react to a rejection based on a single one-line negative review?
- Why does fdisk create a 512B partition when I enter +256K?
- Are There U.S. Laws or Presidential Actions That Cannot Be Overturned by Successor Presidents?
- A function to convert numbers from scientific notation to plain decimal
- When did St Peter receive the Keys of Heaven?
- Can foreigners use Swedish app-driven self service stores?
- how do I fix \operatorname adding a space on the left
- Is internal energy depended on the acceleration of the system?
- My one-liner 'delete old files' command finds the right files but will not delete them
- Hungarian Immigration wrote a code on my passport
- What can I do to limit damage to a ceiling below bathroom after faucet leak?
- Difference between "老", "旧" and "之前" when translating basing on the context?
- Why is Germany looking to import workers from Kenya, specifically?
- Can I use a machine washing to clean neoprene wetsuits/socks/hoods/gloves if I use cold water, no spinning, no bleach and a gentle detergent?
- A thought experiment regarding elliptical orbits
- Text in item doesn't align properly after math mode in enumitem
- How to make a soundless world
The Python IDE for data science and web development
- Twitter Twitter
- Youtube Youtube
7 Ways To Use Jupyter Notebooks inside PyCharm

Jupyter notebooks allow you to tell stories by creating and sharing data, equations, and visualizations sequentially, with a supporting narrative as you go through the notebook.
Jupyter notebooks in PyCharm Professional provide functionality above and beyond that of browser-based Jupyter notebooks, such as code completion, dynamic plots, and quick statistics, to help you explore and work with your data quickly and effectively.
Let’s take a look at 7 ways you can use Jupyter notebooks in PyCharm to achieve your goals. They are:
- Creating or connecting to an existing notebook
- Importing your data
- Getting acquainted with your data
- Using JetBrains AI Assistant
- Exploring your code with PyCharm
- Getting insights from your code
- Sharing your insights and charts
The Jupyter notebook that we used in this demo is available on GitHub .
1. Creating or connecting to an existing notebook
You can create and work on your Jupyter notebooks locally or connect to one remotely with PyCharm. Let’s take a look at both options so you can decide for yourself.
Creating a new Jupyter notebook
To work with a Jupyter notebook locally, you need to go to the Project tool window inside PyCharm, navigate to the location where you want to add the notebook, and invoke a new file. You can do this by using either your keyboard shortcuts ⌘N (macOS) / Alt+Ins (Windows/Linux) or by right-clicking and selecting New | Jupyter Notebook .

Give your new notebook a name, and PyCharm will open it ready for you to start work. You can also drag local Jupyter notebooks into PyCharm, and the IDE will automatically recognise them for you.
Connecting to a remote Jupyter notebook
Alternatively, you can connect to a remote Jupyter notebook by selecting Tools | Add Jupyter Connection . You can then choose to start a local Jupyter server, connect to an existing running local Jupyter server, or connect to a Jupyter server using a URL – all of these options are supported.
Now you have your Jupyter notebook, you need some data!
2. Importing your data
Data generally comes in two formats, CSV or database. Let’s look at importing data from a CSV file first.
Importing from a CSV file
Polars and pandas are the two most commonly used libraries for importing data into Jupyter notebooks. I’ll give you code for both in this section, and you can check out the documentation for both Polars and pandas and learn how Polars is different to pandas .
You need to ensure your CSV is somewhere in your PyCharm project, perhaps in a folder called `data`. Then, you can invoke import pandas and subsequently use it to read the code in:
In this example, airlines.csv is the file containing the data we want to manipulate. To run this and any code cell in PyCharm, use ⇧⏎ (macOS) / Shift+Enter (Windows/Linux). You can also use the green run arrows on the toolbar at the top.
If you prefer to use Polars, you can use this code:
Importing from a database
If your data is in a database, as is often the case for internal projects, importing it into a Jupyter notebook will require just a few more lines of code. First, you need to set up your database connection. In this example, we’re using postgreSQL .
For pandas, you need to use this code to read the data in:
And for Polars, it’s this code:
3. Getting acquainted with your data
Now we’ve read our data in, we can take a look at the DataFrame or `df` as we will refer to it in our code. To print out the DataFrame, you only need a single line of code, regardless of which method you used to read the data in:
PyCharm displays your DataFrame as a table firstly so you can explore it. You can scroll horizontally through the DataFrame and click on any column header to order the data by that column. You can click on the Show Column Statistics icon on the right-hand side and select Compact or Detailed to get some helpful statistics on each column of data.

Dynamic charts
You can use PyCharm to get a dynamic chart of your DataFrame by clicking on the Chart View icon on the left-hand side. We’re using pandas in this example, but Polars DataFrames also have the same option.
Click on the Show Series Settings icon (a cog) on the right-hand side to configure your plot to meet your needs:

In this view, you can hover your mouse over your data to learn more about it and easily spot outliers:

You can do all of this with Polars, too.
4. Using JetBrains AI Assistant
JetBrains AI Assistant has several offerings that can make you more productive when you’re working with Jupyter notebooks inside PyCharm. Let’s take a closer look at how you can use JetBrains AI Assistant to explain a DataFrame, write code, and even explain errors.
Explaining DataFrames
If you’ve got a DataFrame but are unsure where to start, you can click the purple AI icon on the right-hand side of the DataFrame and select Explain DataFrame . JetBrains AI Assistant will use its context to give you an overview of the DataFrame:

You can use the generated explanation to aid your understanding.
Writing Code
You can also get JetBrains AI Assistant to help you write code. Perhaps you know what kind of plot you want, but you’re not 100% sure what the code should look like. Well, now you can use JetBrains AI Assistant to help you. Let’s say you want to use ‘matplotlib’ to create a chart that finds the relationship between ‘TimeMonthName’ and ‘MinutesDelayedWeather’. By specifying the column names, we’re giving more context to the request which improves the reliability of the generated code. Try it with the following prompt:
Give me code using matplotlib to create a chart which finds the relationship between ‘TimeMonthName’ and ‘MinutesDelayedWeather’ for my dataframe df
If you like the resulting code, you can use the Insert Snippet at Caret button to insert the code and then run it:
If you don’t want to open the AI Assistant tool window, you can use the AI cell prompt to ask your questions. For example, we can ask the same question here and get the code we need:
Explaining errors
You can also get JetBrains AI Assistant to explain errors for you. When you get an error, click Explain with AI :

You can use the resulting output to further your understanding of the problem and perhaps even get some code to fix it!
5. Exploring your code
PyCharm can help you get an overview of your Jupyter notebook, complete parts of your code to save your fingers, refactor it as required, debug it, and even add integrations to help you take it to the next level.
Tips for navigating and optimizing your code
Our Jupyter notebooks can grow large quite quickly, but thankfully you can use PyCharm’s Structure view to see all your notebook’s headings by clicking ⌘7 (macOS) / Alt+7 (Windows/Linux).

Code completion
Another helpful feature that you can take advantage of when using Jupyter notebooks inside PyCharm is code completion. You get both basic and type-based code completion out of the box with PyCharm, but you can also enable Full Line Code Completion in PyCharm Professional, which uses a local AI model to provide suggestions. Lastly, JetBrains AI Assistant can also help you write code and discover new libraries and frameworks.

Refactoring
Sometimes you need to refactor your code, and in that case, you only need to know one keyboard shortcut ⌃T (macOS) / Shift+Ctrl+Alt+T (Windows/Linux) then you can choose the refactoring you want to invoke. Pick from popular options such as Rename , Change Signature, and Introduce Variable , or lesser-known options such as Extract Method , to change your code without changing the semantics:

As your Jupyter notebook grows, it’s likely that your import statements will also grow. Sometimes you might import a package such as polars and numpy , but forget that numpy is a transitive dependency of the Polars library and as such, we don’t need to import it separately.
To catch these cases and keep your code tidy, you can invoke Optimize Imports ⌃⌥O (macOS) / Ctrl+Alt+O (Windows/Linux) and PyCharm will remove the ones you don’t need.
Debugging your code
You might not have used the debugger in PyCharm yet, and that’s okay. Just know that it’s there and ready to support you when you need to better understand some behavior in your Jupyter notebook.
Place a breakpoint on the line you’re interested in by clicking in the gutter or by using ⌘F8 (macOS) / Ctrl+F8 (Windows/Linux), and then run your code with the debugger attached with the debug icon on the top toolbar:

You can also invoke PyCharm’s debugger in your Jupyter notebook with ⌥⇧⏎ (macOS) / Shift+Alt+Enter (Windows/Linux). There are some restrictions when it comes to debugging your code in a Jupyter notebook, but please try this out for yourself and share your feedback with us.
Adding integrations into PyCharm
IDEs wouldn’t be complete without the integrations you need. PyCharm Professional 2024.2 brings two new integrations to your workflow: DataBricks and HuggingFace .
You can enable the integrations with both Databricks and HuggingFace by going to your Settings <kbd> ⌘ </kbd> (macOS) / <kbd> Ctrl+Alt+S </kbd> (Windows/Linux), selecting Plugins and searching for the plugin with the corresponding name on the Marketplace tab.
6. Getting insights from your code
When analyzing your data, there’s a difference between categorical and continuous variables. Categorical data has a finite number of discrete groups or categories, whereas continuous data is one continuous measurement. Let’s look at how we can extract different insights from both the categorical and continuous variables in our airlines dataset.
Continuous variables
We can get a sense of how continuous data is distributed by looking at measures of the average value in that data and the spread of the data around the average. In normally distributed data, we can use the mean to measure the average and the standard deviation to measure the spread. However, when data is not distributed normally, we can get more accurate information using the median and the interquartile range (this is the difference between the seventy-fifth and twenty-fifth percentiles). Let’s look at one of our continuous variables to understand the difference between these measurements.
In our dataset, we have lots of continuous variables, but we’ll work with `NumDelaysLateAircraft` to see what we can learn. Let’s use the following code to get some summary statistics for just that column:
Looking at this data, we can see that there is a big difference between the `mean` of ~789 and the ‘median’ (our fiftieth percentile, indicated by “50%” in the table below) of ~618.

This indicates a skew in our variable’s distribution, so let’s use PyCharm to explore it further. Click on the Chart View icon at the top left. Once the chart has been rendered, we’ll change the series settings represented by the cog on the right-hand side of the screen. Change your x-axis to `NumDelaysLateAircraft` and your y-axis to `NumDelaysLateAircraft`.
Now drop down the y-axis using the little arrow and select `count`. The final step is to change the chart type to Histogram using the icons in the top-right corner:

Now that we can see the skew laid out visually, we can see that most of the time, the delays are not too excessive. However, we have a number of more extreme delays – one aircraft is an outlier on the right and it was delayed by 4,509 minutes, which is just over three days!
In statistics, the mean is very sensitive to outliers because it’s a geometric average, unlike the median, which, if you ordered all observations in your variable, would sit exactly in the middle of these values. When the mean is higher than the median, it’s because you have outliers on the right-hand side of the data, the higher side, as we had here. In such cases, the median is a better indicator of the true average delay, as you can see if you look at the histogram.
Categorical variables
Let’s take a look at how we can use code to get some insights from our categorical variables. In order to get something that’s a little more interesting than just `AirportCode`, we’ll analyze how many aircraft were delayed by weather, `NumDelaysWeather`, in the different months of the year, `TimeMonthName`.
Use this code to group `NumDelaysWeather` with `TimeMonthName`:
This gives us the DataFrame again in table format, but click the Chart View icon on the left-hand side of the PyCharm UI to see what we can learn:

This is okay, but it would be helpful to have the months ordered according to the Gregorian calendar. Let’s first create a variable for the months that we expect:
Now we can ask PyCharm to use the order that we’ve just defined in `month_order`:
We then click on the Chart View icon once more , but something’s wrong!

Are we really saying that there were no flights delayed in February? That can’t be right. Let’s check our assumption with some more code:
Aha! Now we can see that `Febuary` has been misspelt in our data set, so the correct spelling in our variable name does not match. Let’s update the spelling in our dataset with this code:
Great, that looks right. Now we should be able to re-run our earlier code and get a chart view that we can interpret:

From this view, we can see that there is a higher number of delays during the months of December, January, and February, and then again in June, July, and August. However, we have not standardized this data against the total number of flights, so there may just be more flights in those months, which would cause these results along with an increased number of delays in those summer and winter months.
7. Sharing your insights and charts
When your masterpiece is complete, you’ll probably want to export data, and you can do that in various ways with Jupyter notebooks in PyCharm.
Exporting a DataFrame
You can export a DataFrame by clicking on the down arrow on the right-hand side:

You have lots of helpful formats to choose from, including SQL, CSV, and JSON:

Exporting charts
If you prefer to export the interactive plot, you can do that too by clicking on the Export to PNG icon on the right-hand side:

Viewing your notebook as a browser
You can view your whole Jupyter notebook at any time in a browser by clicking the icon in the top-right corner of your notebook:

Finally, if you want to export your Jupyter notebook to a Python file, 2024.2 lets you do that too! Right-click on your Jupyter notebook in the Project tool window and select Convert to Python File . Follow the instructions, and you’re done!
Using Jupyter notebooks inside PyCharm Professional provides extensive functionality, enabling you to create code faster, explore data easily, and export your projects in the formats that matter to you.
Download PyCharm Professional to try it out for yourself! Get an extended trial today and experience the difference PyCharm Professional can make in your data science endeavors.
Use the promo code “ PyCharmNotebooks ” at checkout to activate your free 60-day subscription to PyCharm Professional. The free subscription is available for individual users only.

Subscribe to PyCharm Blog updates
By submitting this form, I agree that JetBrains s.r.o. ("JetBrains") may use my name, email address, and location data to send me newsletters, including commercial communications, and to process my personal data for this purpose. I agree that JetBrains may process said data using third-party services for this purpose in accordance with the JetBrains Privacy Policy . I understand that I can revoke this consent at any time in my profile . In addition, an unsubscribe link is included in each email.
Thanks, we've got you!
Discover more

How to Use Jupyter Notebooks in PyCharm
Read this guide to learn how to use Jupyter notebooks in PyCharm to boost your productivity when working with data.

How to Build Chatbots With LangChain
Discover how LangChain lets chatbots interact with LLMs, and follow this guide to build a context-aware chatbot that delivers accurate, relevant responses.

Polars vs. pandas: What’s the Difference?
Explore the key distinctions between Polars and Pandas, two data manipulation tools. Discover which framework suits your data processing needs best.

How to Move From pandas to Polars
Considering replacing pandas with Polars? Learn how to make the switch, what to keep in mind, and how PyCharm can help.
IMAGES
VIDEO
COMMENTS
RISE also works with Notebook widgets. Try creating a new cell with the following code: from ipywidgets import interact. def my_function(x): return x. # create a slider. interact(my_function, x=20) Now start the slideshow on that cell and try running the cell (SHIFT+ENTER). You should see something like this:
You can create a presentation directly from Jupyter Notebook. The presentation slides can be constructed from single, multi-code or Markdown cells. The cell's code can be hidden in the presentation (to not scare nontechnical viewers). The final slides can be shared as a website or converted to a PDF file.
Steps to Create Presentations using RISE in Jupyter. Now, let's move on to setting up your presentation slides. You will find the RISE icon on the top of the Jupyter Notebook page. Setting Up Presentation Slides. Setting up presentation slides involves configuring the slide types and layout for your presentation. Open Jupyter Notebook.
This is an alternative to copy-and-pasting screen captures into other presentation software. The first step is to enable the Slideshow option in the View > Cell Toolbar options. Just click on the Slideshow option and continue reading. Enable Slideshow. Each cell in the Jupyter Notebook will now have a Slide Type option in the upper-right corner.
Creating presentations in Jupyter Notebook is a great alternative to manually updating slides in other presentation creation software. If your data changes, you just re-execute the cell and slide chart is updated. Jupyter Notebook is using Reveal.js (opens in a new tab) for creating slides from cells. The standard approach is to write slides ...
Configure settings in Jupyter Notebook to transform cells into slides. Before proceeding with the conversion process to HTML as outlined above, you need to make some configurations in Jupyter Notebook using Anaconda.. This configuration allows you to selectively choose which cells to display, ensuring that only the relevant content appears in the HTML output, showcasing the most important code ...
Jupyter's "nbconvert" to convert the notebook to Markdown. Pandoc to convert the Markdown to LaTeX while interpolating the raw_attribute bits. Beamer to convert the Pandoc output to a PDF slide-deck. Beamer's beamerarticle mode. All combined with a little bit of duct-tape, in the form of a UNIX shell script, to produce slide-deck creation software.
One of them is "Jupyter's built-in slideshow feature". To create interactive slideshows in Jupyter Notebook with the help of its built-in feature, perform the following steps: Step 1: Open a New Notebook. To start with, open a new notebook and rename it. Step 2: Create new Slides.
The process I followed to create the slides is very simple. Open a blank Jupyter notebook. Add a cell and convert it to Markdown (either esc + m) or by using the drop down menu at the top of the notebook. Add your text, equation or image to the cell (images can be added via the edit menu, though some HTML tags may be needed to render and/or ...
The best way to walk through this tutorial is using the accompanying Jupyter Notebook: [Jupyter Notebook] - In the last year I've started presenting work using Jupyter Notebooks, rebelling against the Bill Gates'-driven status-quo. Here I'll explain how to do it. It's not difficult, but in my opinion makes presentations look slicker, whilst allowing you to run code live in a presentation ...
In this tutorial, you will learn how to use Jupyter Notebooks to create slide show presentations. This allows you to run and edit live code in your slides. If playback doesn't begin shortly, try restarting your device. Videos you watch may be added to the TV's watch history and influence TV recommendations. To avoid this, cancel and sign in to ...
The --to option actually accepts a number of possible output formats, including PDF (try jupyter nbconvert --help to see other options), but the slides argument targets reveal.js slides.--reveal-prefix should point to your local reveal.js directory, and --post serve specifies that the reveal.js serve command should be run following conversion (a tab containing the live presentation should be ...
Start a Jupyter Notebook/Jupyter Lab and add content. Step 6. Now that you have set up a github repo and you have added that repo as a submodule to your computer or instance, let's start building the contents of the slide deck. ... Let's create a simple five slide presentation in jupyter notebook. The syntax is simple and we will create ...
RISE is a Jupyter Notebook extension that allows you to easily create reveal.js-based presentations from Jupyter Notebook. RISE is a relatively powerful tool with a lot of in-built functionality, which is also simple enough to be used by beginners.
Jupyter notebook is a powerful tool to interactively code in web-based notebooks with a whole plethora of programming languages. With it, it is also possible to create web-based slideshows with reveal.js. Preparation. The slides functionality is already included in Jupyter Notebook, so there is no need to install plugins.
Next you will need to run the following command: 1. 1. jupyter nbconvert slideshow.ipynb --to slides --post serve. Running the slideshow. To navigate your slideshow, you can use your left and ...
Just complete your notebook and then configure each cell using the "Notebook Tools" tab on the far left (as shown in screenshot). Then save and close the notebook and run below command to output the slides. Open the terminal and navigate to the recently saved .ipynb and run. jupyter nbconvert Untitled2.ipynb --to slides. For slides or say.
All the libraries above are not required to make the slides work, you can just simply use Plotly, Seaborn, or even simply Matplotlib. You can check the full notebook on my GitHub repo here. Jupyter Notebook Slideshow View and Setting. In Jupyter Notebook, each cell can play a part in the presentation slides.
Create dynamic and content rich presentations in Jupyter # jupyter # python # productivity # showdev. Jupyter is an effective tool for data analysis whether it is classic notebook, lab, or notebooks in popular text editors like VS code. You do analysis but when it comes to presenting your results, most of the time you need to move out of the ...
nbslide. Slideshow extension for JupyterLab. This extension adds a presentation mode for Jupyter Lab that hides cells during a presentation to help the audience focus on the part that matters. In comparison to RISE, nbslide is a simpler extension that keeps the notebook look and feel and executes cells automatically during the presentation mode.
Here you can see a reproducible example to create Jupyter notebook slides via Anaconda-navigator: When running this command in the terminal: jupyter nbconvert slides_test.ipynb --to slides --post serve. It will outputs this in your browser: And for the code cell output: This is very nice and I would like to use this but in VScode.
Jupyter notebooks in PyCharm Professional provide functionality above and beyond that of browser-based Jupyter notebooks, such as code completion, dynamic plots, and quick statistics, to help you explore and work with your data quickly and effectively. Let's take a look at 7 ways you can use Jupyter notebooks in PyCharm to achieve your goals.